29
/
en
AIzaSyAYiBZKx7MnpbEhh9jyipgxe19OcubqV5w
April 1, 2024
30067
Euro area
EMU
false
2
1
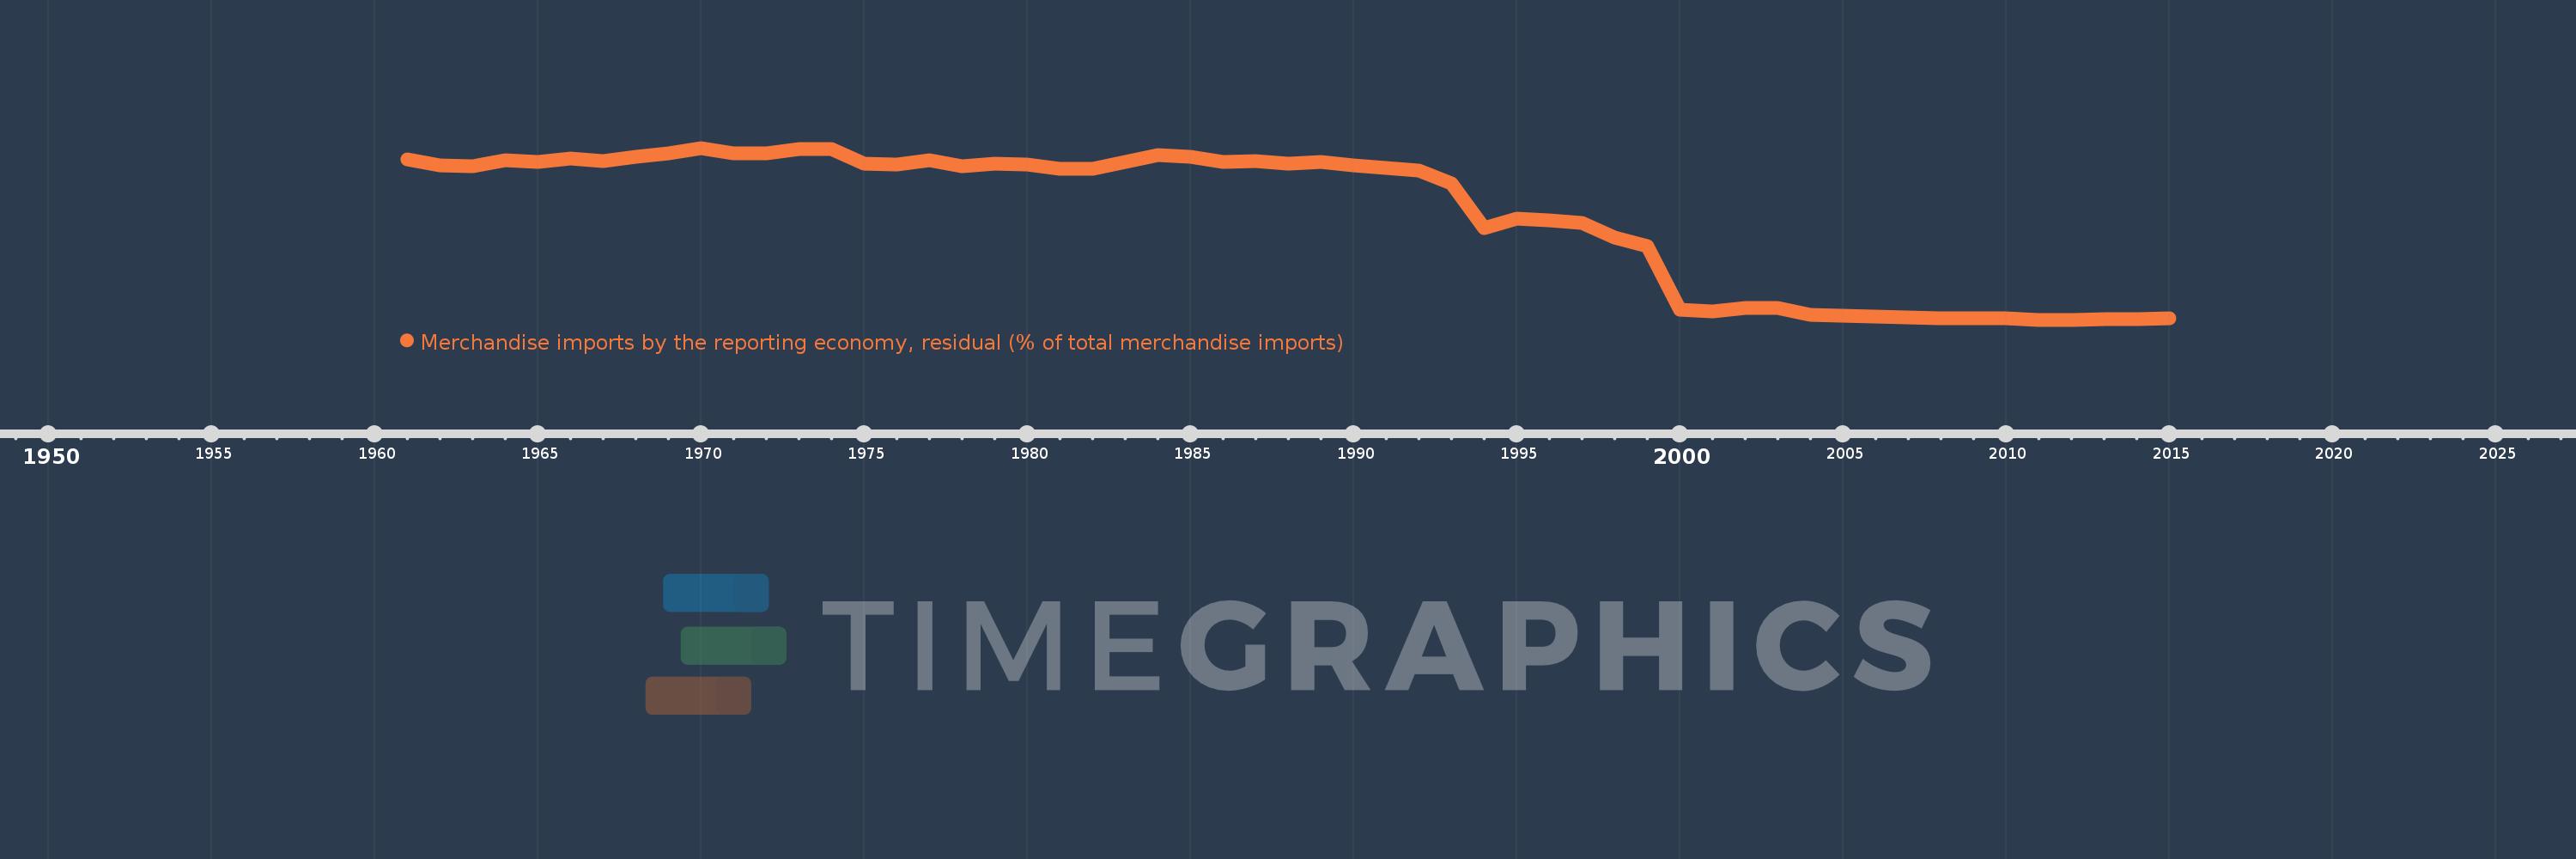
Merchandise imports by the reporting economy, residual (% of total merchandise imports)
2015,2014,2013,2012,2011,2010,2009,2008,2007,2006,2005,2004,2003,2002,2001,2000,1999,1998,1997,1996,1995,1994,1993,1992,1991,1990,1989,1988,1987,1986,1985,1984,1983,1982,1981,1980,1979,1978,1977,1976,1975,1974,1973,1972,1971,1970,1969,1968,1967,1966,1965,1964,1963,1962,1961
This statistics in other country:
AfghanistanAlbaniaAlgeriaAmerican SamoaAngolaAntigua and BarbudaArab WorldArgentinaArmeniaArubaAustraliaAustriaAzerbaijanBahamas, TheBahrainBangladeshBarbadosBelarusBelgiumBelizeBeninBermudaBoliviaBosnia and HerzegovinaBrazilBrunei DarussalamBulgariaBurkina FasoBurundiCabo VerdeCambodiaCameroonCanadaCaribbean small statesCentral African RepublicCentral Europe and the BalticsChadChileChinaColombiaComorosCongo, Dem. Rep.Congo, Rep.Costa RicaCote d'IvoireCroatiaCubaCyprusCzech RepublicDenmarkDjiboutiDominicaDominican RepublicEarly-demographic dividendEast Asia & PacificEast Asia & Pacific (excluding high income)East Asia & Pacific (IDA & IBRD countries)EcuadorEgypt, Arab Rep.El SalvadorEquatorial GuineaEstoniaEthiopiaEuro areaEurope & Central AsiaEurope & Central Asia (excluding high income)Europe & Central Asia (IDA & IBRD countries)European UnionFaroe IslandsFijiFinlandFragile and conflict affected situationsFranceFrench PolynesiaGabonGambia, TheGeorgiaGermanyGhanaGibraltarGreeceGreenlandGrenadaGuamGuatemalaGuineaGuinea-BissauGuyanaHaitiHeavily indebted poor countries (HIPC)High incomeHondurasHong Kong SAR, ChinaHungaryIBRD onlyIcelandIDA & IBRD totalIDA blendIDA onlyIDA totalIndiaIndonesiaIran, Islamic Rep.IraqIrelandIsraelItalyJamaicaJapanJordanKazakhstanKenyaKiribatiKorea, Dem. People’s Rep.Korea, Rep.KosovoKuwaitKyrgyz RepublicLao PDRLate-demographic dividendLatin America & Caribbean Latin America & Caribbean (excluding high income)Latin America & the Caribbean (IDA & IBRD countries)LatviaLeast developed countries: UN classificationLebanonLiberiaLibyaLithuaniaLow & middle incomeLow incomeLower middle incomeLuxembourgMacao SAR, ChinaMacedonia, FYRMadagascarMalawiMalaysiaMaldivesMaliMaltaMauritaniaMauritiusMexicoMiddle East & North AfricaMiddle East & North Africa (excluding high income)Middle East & North Africa (IDA & IBRD countries)Middle incomeMoldovaMongoliaMontenegroMoroccoMozambiqueMyanmarNauruNepalNetherlandsNew CaledoniaNew ZealandNicaraguaNigerNigeriaNorth AmericaNorwayOECD membersOmanOther small statesPacific island small statesPakistanPanamaPapua New GuineaParaguayPeruPhilippinesPolandPortugalPost-demographic dividendPre-demographic dividendQatarRomaniaRussian FederationRwandaSamoaSao Tome and PrincipeSaudi ArabiaSenegalSerbiaSeychellesSierra LeoneSingaporeSlovak RepublicSloveniaSmall statesSolomon IslandsSomaliaSouth AfricaSouth AsiaSouth Asia (IDA & IBRD)SpainSri LankaSt. Kitts and NevisSt. LuciaSt. Vincent and the GrenadinesSub-Saharan Africa Sub-Saharan Africa (excluding high income)Sub-Saharan Africa (IDA & IBRD countries)SudanSurinameSwedenSwitzerlandSyrian Arab RepublicTajikistanTanzaniaThailandTogoTongaTrinidad and TobagoTunisiaTurkeyTurkmenistanTuvaluUgandaUkraineUnited Arab EmiratesUnited KingdomUnited StatesUpper middle incomeUruguayUzbekistanVanuatuVenezuela, RBVietnamWorldYemen, Rep.ZambiaZimbabwe Timeline:
This timeline shows a graph from 1961 to 2015 of Euro area. No data until 1960. Number of actual observations by date: 55.
Source name:
World Development Indicators
Source organization:
World Bank staff estimates based data from International Monetary Fund's Direction of Trade database.
Categories, topics:
Private Sector, Trade
Last updated:
apr 23, 2017
Indicators value changes by year
Maximum:
12.403
jan 1, 1970
At the date of observation
Value
Absolute change
Change from previous value
jan 1, 1961
11.568
+11.568
0.0%
jan 1, 1962
11.157
-0.411
-3.55%
jan 1, 1963
11.105
-0.052
-0.47%
jan 1, 1964
11.497
+0.393
3.54%
jan 1, 1965
11.41
-0.088
-0.76%
jan 1, 1966
11.657
+0.248
2.17%
jan 1, 1967
11.446
-0.211
-1.81%
jan 1, 1968
11.8
+0.354
3.09%
jan 1, 1969
12.018
+0.218
1.85%
jan 1, 1970
12.403
+0.386
3.21%
jan 1, 1971
11.988
-0.416
-3.35%
jan 1, 1972
12.039
+0.051
0.43%
jan 1, 1973
12.346
+0.307
2.55%
jan 1, 1974
12.34
-0.006
-0.05%
jan 1, 1975
11.302
-1.038
-8.41%
jan 1, 1976
11.224
-0.078
-0.69%
jan 1, 1977
11.521
+0.297
2.64%
jan 1, 1978
11.073
-0.448
-3.89%
jan 1, 1979
11.307
+0.234
2.12%
jan 1, 1980
11.221
-0.086
-0.76%
jan 1, 1981
10.931
-0.29
-2.58%
jan 1, 1982
10.934
+0.003
0.03%
jan 1, 1983
11.402
+0.468
4.28%
jan 1, 1984
11.9
+0.498
4.37%
jan 1, 1985
11.796
-0.105
-0.88%
jan 1, 1986
11.413
-0.382
-3.24%
jan 1, 1987
11.481
+0.067
0.59%
jan 1, 1988
11.268
-0.212
-1.85%
jan 1, 1989
11.423
+0.155
1.37%
jan 1, 1990
11.182
-0.242
-2.11%
jan 1, 1991
10.986
-0.196
-1.75%
jan 1, 1992
10.817
-0.168
-1.53%
jan 1, 1993
9.89
-0.928
-8.58%
jan 1, 1994
6.694
-3.195
-32.31%
jan 1, 1995
7.384
+0.689
10.3%
jan 1, 1996
7.263
-0.121
-1.63%
jan 1, 1997
7.053
-0.21
-2.9%
jan 1, 1998
6.027
-1.026
-14.54%
jan 1, 1999
5.419
-0.608
-10.09%
jan 1, 2000
0.848
-4.571
-84.36%
jan 1, 2001
0.731
-0.117
-13.77%
jan 1, 2002
0.991
+0.26
35.61%
jan 1, 2003
1.017
+0.026
2.65%
jan 1, 2004
0.472
-0.545
-53.57%
jan 1, 2005
0.444
-0.028
-5.99%
jan 1, 2006
0.406
-0.038
-8.66%
jan 1, 2007
0.317
-0.089
-21.97%
jan 1, 2008
0.259
-0.058
-18.19%
jan 1, 2009
0.252
-0.007
-2.6%
jan 1, 2010
0.26
+0.008
3.22%
jan 1, 2011
0.15
-0.11
-42.27%
jan 1, 2012
0.153
+0.002
1.63%
jan 1, 2013
0.167
+0.014
9.09%
jan 1, 2014
0.182
+0.015
9.25%
jan 1, 2015
0.241
+0.059
32.15%
Ranking of countries by current statistics by years


Comments: