29
/
en
AIzaSyAYiBZKx7MnpbEhh9jyipgxe19OcubqV5w
April 1, 2024
191652
Malta
MLT
true
2
1
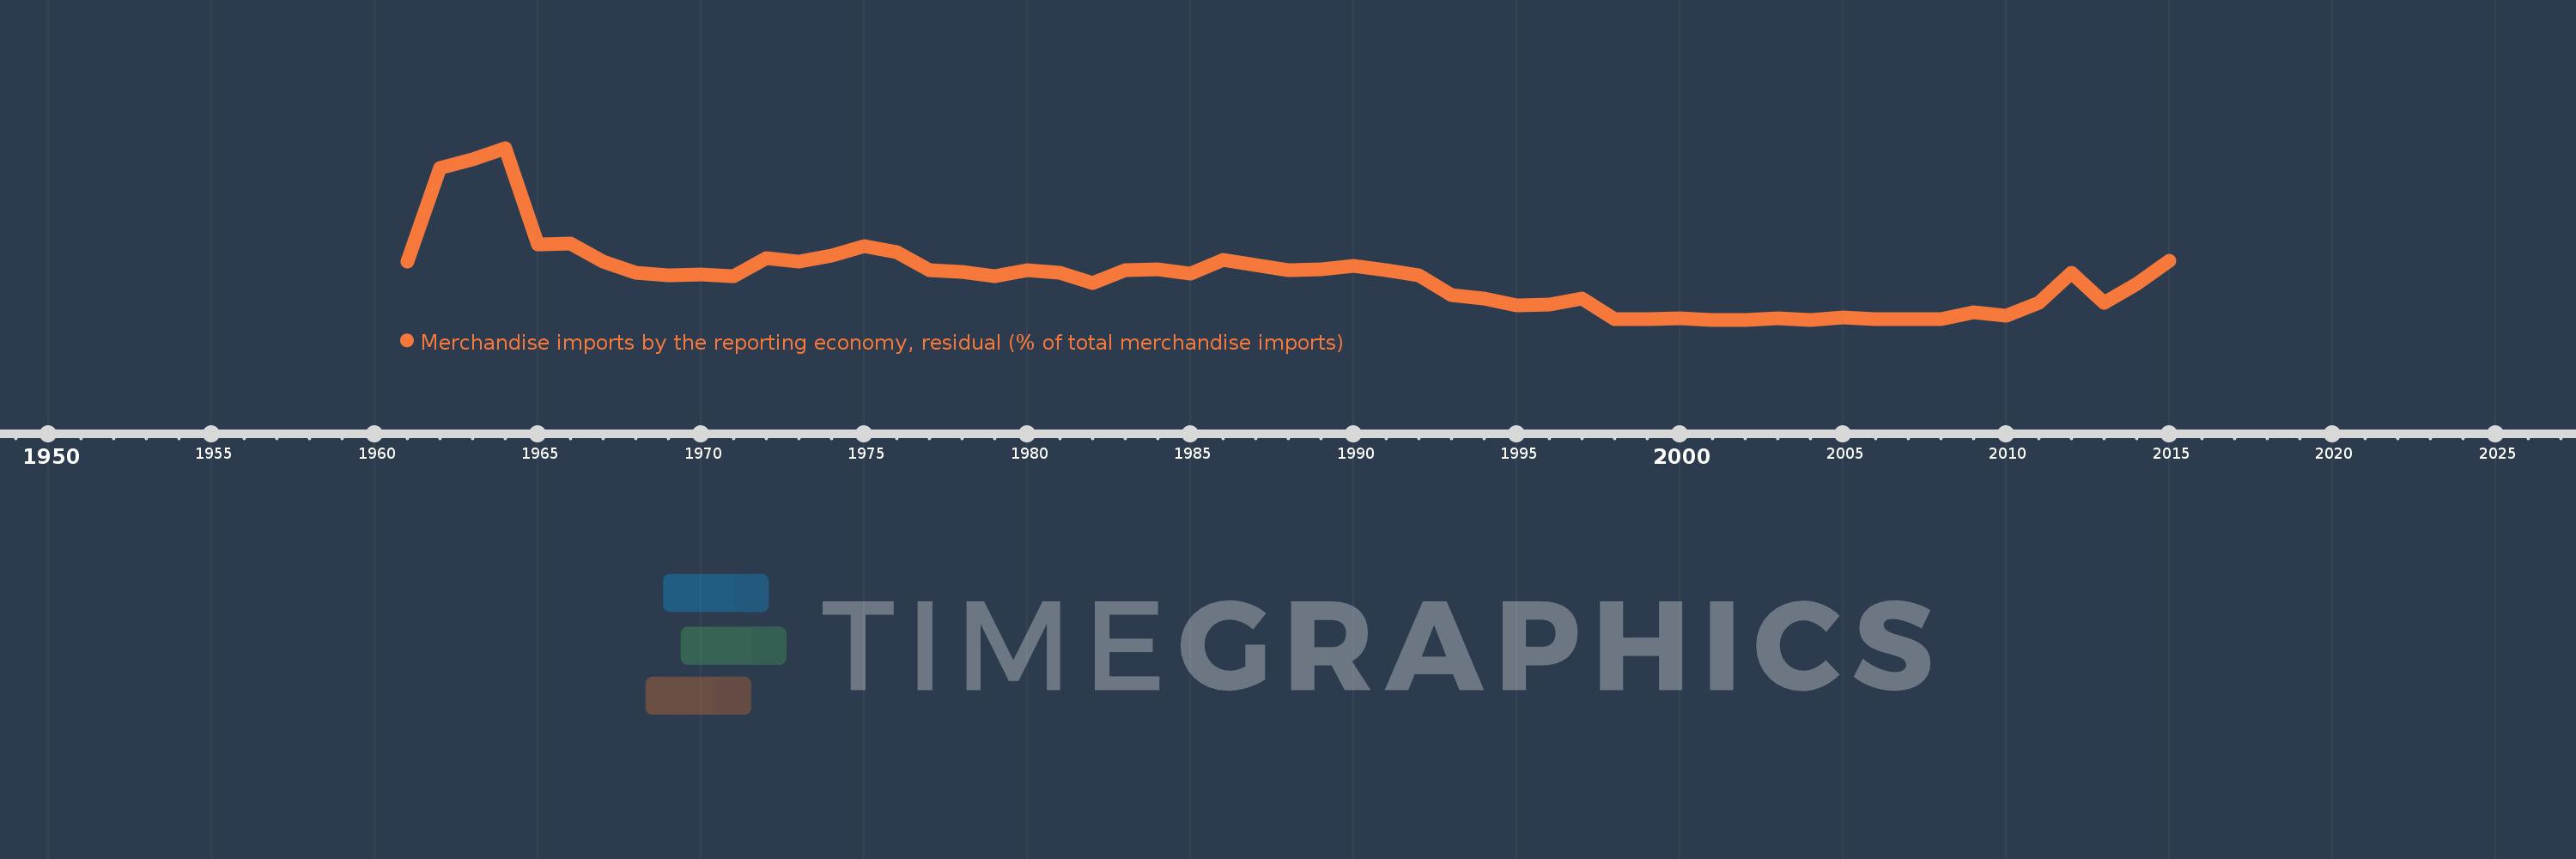
Merchandise imports by the reporting economy, residual (% of total merchandise imports)
2015,2014,2013,2012,2011,2010,2009,2008,2007,2006,2005,2004,2003,2002,2001,2000,1999,1998,1997,1996,1995,1994,1993,1992,1991,1990,1989,1988,1987,1986,1985,1984,1983,1982,1981,1980,1979,1978,1977,1976,1975,1974,1973,1972,1971,1970,1969,1968,1967,1966,1965,1964,1963,1962,1961
This statistics in other country:
AfghanistanAlbaniaAlgeriaAmerican SamoaAngolaAntigua and BarbudaArab WorldArgentinaArmeniaArubaAustraliaAustriaAzerbaijanBahamas, TheBahrainBangladeshBarbadosBelarusBelgiumBelizeBeninBermudaBoliviaBosnia and HerzegovinaBrazilBrunei DarussalamBulgariaBurkina FasoBurundiCabo VerdeCambodiaCameroonCanadaCaribbean small statesCentral African RepublicCentral Europe and the BalticsChadChileChinaColombiaComorosCongo, Dem. Rep.Congo, Rep.Costa RicaCote d'IvoireCroatiaCubaCyprusCzech RepublicDenmarkDjiboutiDominicaDominican RepublicEarly-demographic dividendEast Asia & PacificEast Asia & Pacific (excluding high income)East Asia & Pacific (IDA & IBRD countries)EcuadorEgypt, Arab Rep.El SalvadorEquatorial GuineaEstoniaEthiopiaEuro areaEurope & Central AsiaEurope & Central Asia (excluding high income)Europe & Central Asia (IDA & IBRD countries)European UnionFaroe IslandsFijiFinlandFragile and conflict affected situationsFranceFrench PolynesiaGabonGambia, TheGeorgiaGermanyGhanaGibraltarGreeceGreenlandGrenadaGuamGuatemalaGuineaGuinea-BissauGuyanaHaitiHeavily indebted poor countries (HIPC)High incomeHondurasHong Kong SAR, ChinaHungaryIBRD onlyIcelandIDA & IBRD totalIDA blendIDA onlyIDA totalIndiaIndonesiaIran, Islamic Rep.IraqIrelandIsraelItalyJamaicaJapanJordanKazakhstanKenyaKiribatiKorea, Dem. People’s Rep.Korea, Rep.KosovoKuwaitKyrgyz RepublicLao PDRLate-demographic dividendLatin America & Caribbean Latin America & Caribbean (excluding high income)Latin America & the Caribbean (IDA & IBRD countries)LatviaLeast developed countries: UN classificationLebanonLiberiaLibyaLithuaniaLow & middle incomeLow incomeLower middle incomeLuxembourgMacao SAR, ChinaMacedonia, FYRMadagascarMalawiMalaysiaMaldivesMaliMaltaMauritaniaMauritiusMexicoMiddle East & North AfricaMiddle East & North Africa (excluding high income)Middle East & North Africa (IDA & IBRD countries)Middle incomeMoldovaMongoliaMontenegroMoroccoMozambiqueMyanmarNauruNepalNetherlandsNew CaledoniaNew ZealandNicaraguaNigerNigeriaNorth AmericaNorwayOECD membersOmanOther small statesPacific island small statesPakistanPanamaPapua New GuineaParaguayPeruPhilippinesPolandPortugalPost-demographic dividendPre-demographic dividendQatarRomaniaRussian FederationRwandaSamoaSao Tome and PrincipeSaudi ArabiaSenegalSerbiaSeychellesSierra LeoneSingaporeSlovak RepublicSloveniaSmall statesSolomon IslandsSomaliaSouth AfricaSouth AsiaSouth Asia (IDA & IBRD)SpainSri LankaSt. Kitts and NevisSt. LuciaSt. Vincent and the GrenadinesSub-Saharan Africa Sub-Saharan Africa (excluding high income)Sub-Saharan Africa (IDA & IBRD countries)SudanSurinameSwedenSwitzerlandSyrian Arab RepublicTajikistanTanzaniaThailandTogoTongaTrinidad and TobagoTunisiaTurkeyTurkmenistanTuvaluUgandaUkraineUnited Arab EmiratesUnited KingdomUnited StatesUpper middle incomeUruguayUzbekistanVanuatuVenezuela, RBVietnamWorldYemen, Rep.ZambiaZimbabwe Timeline:
This timeline shows a graph from 1961 to 2015 of Malta. No data until 1960. Number of actual observations by date: 55.
Source name:
World Development Indicators
Source organization:
World Bank staff estimates based data from International Monetary Fund's Direction of Trade database.
Categories, topics:
Private Sector, Trade
Last updated:
apr 23, 2017
Indicators value changes by year
Maximum:
14.531
jan 1, 1964
At the date of observation
Value
Absolute change
Change from previous value
jan 1, 1961
4.942
+4.942
0.0%
jan 1, 1962
12.843
+7.901
159.86%
jan 1, 1963
13.547
+0.704
5.48%
jan 1, 1964
14.531
+0.984
7.26%
jan 1, 1965
6.371
-8.16
-56.16%
jan 1, 1966
6.451
+0.08
1.26%
jan 1, 1967
4.938
-1.513
-23.46%
jan 1, 1968
3.999
-0.939
-19.01%
jan 1, 1969
3.785
-0.214
-5.34%
jan 1, 1970
3.804
+0.019
0.5%
jan 1, 1971
3.713
-0.092
-2.41%
jan 1, 1972
5.239
+1.526
41.11%
jan 1, 1973
4.927
-0.312
-5.96%
jan 1, 1974
5.452
+0.525
10.66%
jan 1, 1975
6.255
+0.803
14.73%
jan 1, 1976
5.746
-0.509
-8.14%
jan 1, 1977
4.213
-1.533
-26.68%
jan 1, 1978
4.022
-0.19
-4.52%
jan 1, 1979
3.672
-0.351
-8.72%
jan 1, 1980
4.177
+0.505
13.76%
jan 1, 1981
4.0
-0.177
-4.24%
jan 1, 1982
3.083
-0.917
-22.92%
jan 1, 1983
4.211
+1.127
36.57%
jan 1, 1984
4.237
+0.027
0.63%
jan 1, 1985
3.893
-0.344
-8.12%
jan 1, 1986
5.03
+1.136
29.19%
jan 1, 1987
4.594
-0.436
-8.67%
jan 1, 1988
4.189
-0.404
-8.8%
jan 1, 1989
4.282
+0.093
2.22%
jan 1, 1990
4.557
+0.275
6.43%
jan 1, 1991
4.164
-0.394
-8.64%
jan 1, 1992
3.763
-0.401
-9.63%
jan 1, 1993
2.065
-1.698
-45.12%
jan 1, 1994
1.782
-0.283
-13.69%
jan 1, 1995
1.221
-0.561
-31.5%
jan 1, 1996
1.278
+0.057
4.66%
jan 1, 1997
1.817
+0.539
42.19%
jan 1, 1998
0.017
-1.799
-99.05%
jan 1, 1999
0.039
+0.022
124.79%
jan 1, 2000
0.105
+0.066
170.62%
jan 1, 2001
0.0
-0.105
-100.0%
jan 1, 2002
0.0
+0.0
4.83 bln%
jan 1, 2003
0.103
+0.103
36.33K%
jan 1, 2004
0.013
-0.09
-87.38%
jan 1, 2005
0.193
+0.18
1.38K%
jan 1, 2006
0.078
-0.115
-59.44%
jan 1, 2007
0.048
-0.03
-38.87%
jan 1, 2008
0.081
+0.033
69.43%
jan 1, 2009
0.645
+0.564
696.2%
jan 1, 2010
0.34
-0.305
-47.29%
jan 1, 2011
1.447
+1.107
325.64%
jan 1, 2012
3.997
+2.55
176.28%
jan 1, 2013
1.419
-2.578
-64.51%
jan 1, 2014
3.06
+1.641
115.7%
jan 1, 2015
4.969
+1.909
62.39%
Ranking of countries by current statistics by years


Comments: