29
/
en
AIzaSyAYiBZKx7MnpbEhh9jyipgxe19OcubqV5w
April 1, 2024
233830
Sao Tome and Principe
STP
true
2
1
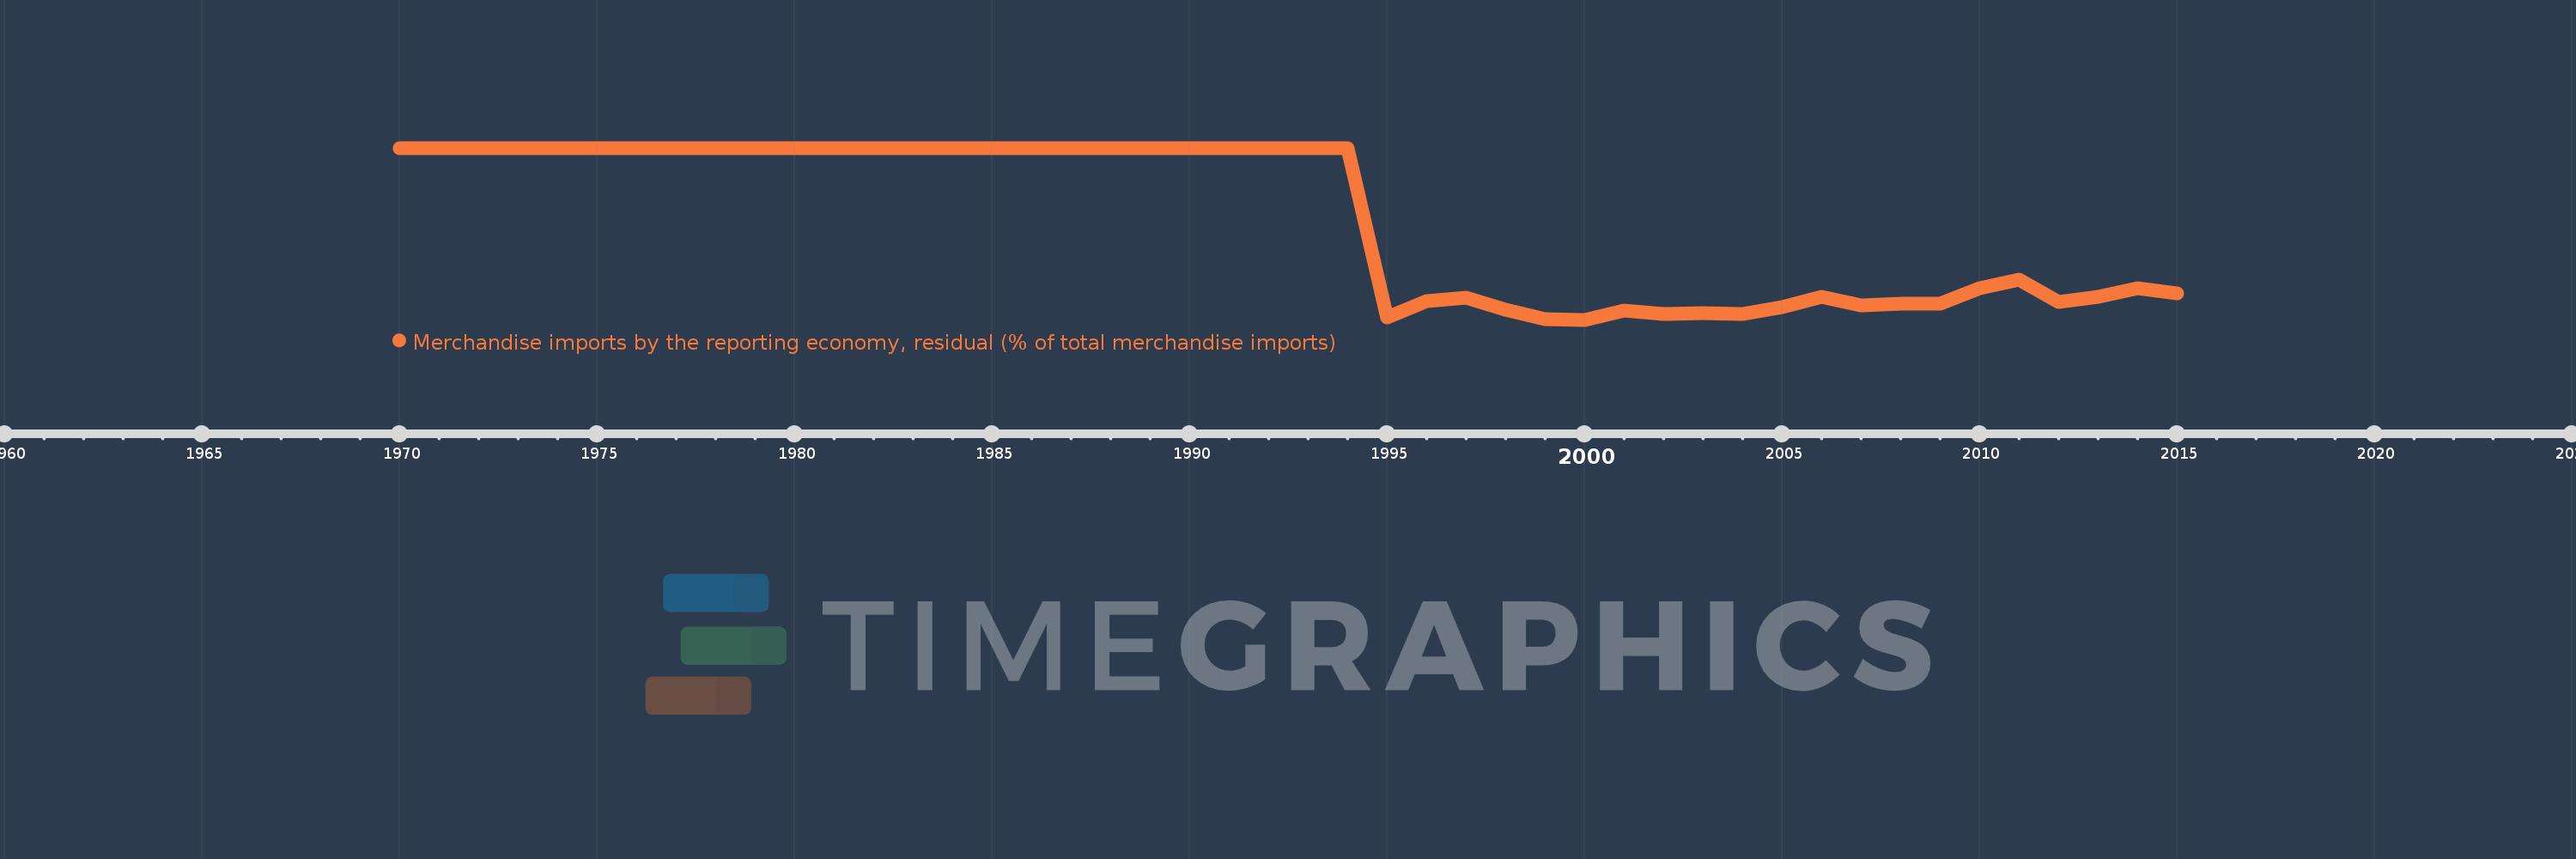
Merchandise imports by the reporting economy, residual (% of total merchandise imports)
2015,2014,2013,2012,2011,2010,2009,2008,2007,2006,2005,2004,2003,2002,2001,2000,1999,1998,1997,1996,1995,1994,1993,1992,1991,1990,1989,1988,1987,1986,1985,1984,1983,1982,1978,1977,1976,1975,1974,1971,1970
This statistics in other country:
AfghanistanAlbaniaAlgeriaAmerican SamoaAngolaAntigua and BarbudaArab WorldArgentinaArmeniaArubaAustraliaAustriaAzerbaijanBahamas, TheBahrainBangladeshBarbadosBelarusBelgiumBelizeBeninBermudaBoliviaBosnia and HerzegovinaBrazilBrunei DarussalamBulgariaBurkina FasoBurundiCabo VerdeCambodiaCameroonCanadaCaribbean small statesCentral African RepublicCentral Europe and the BalticsChadChileChinaColombiaComorosCongo, Dem. Rep.Congo, Rep.Costa RicaCote d'IvoireCroatiaCubaCyprusCzech RepublicDenmarkDjiboutiDominicaDominican RepublicEarly-demographic dividendEast Asia & PacificEast Asia & Pacific (excluding high income)East Asia & Pacific (IDA & IBRD countries)EcuadorEgypt, Arab Rep.El SalvadorEquatorial GuineaEstoniaEthiopiaEuro areaEurope & Central AsiaEurope & Central Asia (excluding high income)Europe & Central Asia (IDA & IBRD countries)European UnionFaroe IslandsFijiFinlandFragile and conflict affected situationsFranceFrench PolynesiaGabonGambia, TheGeorgiaGermanyGhanaGibraltarGreeceGreenlandGrenadaGuamGuatemalaGuineaGuinea-BissauGuyanaHaitiHeavily indebted poor countries (HIPC)High incomeHondurasHong Kong SAR, ChinaHungaryIBRD onlyIcelandIDA & IBRD totalIDA blendIDA onlyIDA totalIndiaIndonesiaIran, Islamic Rep.IraqIrelandIsraelItalyJamaicaJapanJordanKazakhstanKenyaKiribatiKorea, Dem. People’s Rep.Korea, Rep.KosovoKuwaitKyrgyz RepublicLao PDRLate-demographic dividendLatin America & Caribbean Latin America & Caribbean (excluding high income)Latin America & the Caribbean (IDA & IBRD countries)LatviaLeast developed countries: UN classificationLebanonLiberiaLibyaLithuaniaLow & middle incomeLow incomeLower middle incomeLuxembourgMacao SAR, ChinaMacedonia, FYRMadagascarMalawiMalaysiaMaldivesMaliMaltaMauritaniaMauritiusMexicoMiddle East & North AfricaMiddle East & North Africa (excluding high income)Middle East & North Africa (IDA & IBRD countries)Middle incomeMoldovaMongoliaMontenegroMoroccoMozambiqueMyanmarNauruNepalNetherlandsNew CaledoniaNew ZealandNicaraguaNigerNigeriaNorth AmericaNorwayOECD membersOmanOther small statesPacific island small statesPakistanPanamaPapua New GuineaParaguayPeruPhilippinesPolandPortugalPost-demographic dividendPre-demographic dividendQatarRomaniaRussian FederationRwandaSamoaSao Tome and PrincipeSaudi ArabiaSenegalSerbiaSeychellesSierra LeoneSingaporeSlovak RepublicSloveniaSmall statesSolomon IslandsSomaliaSouth AfricaSouth AsiaSouth Asia (IDA & IBRD)SpainSri LankaSt. Kitts and NevisSt. LuciaSt. Vincent and the GrenadinesSub-Saharan Africa Sub-Saharan Africa (excluding high income)Sub-Saharan Africa (IDA & IBRD countries)SudanSurinameSwedenSwitzerlandSyrian Arab RepublicTajikistanTanzaniaThailandTogoTongaTrinidad and TobagoTunisiaTurkeyTurkmenistanTuvaluUgandaUkraineUnited Arab EmiratesUnited KingdomUnited StatesUpper middle incomeUruguayUzbekistanVanuatuVenezuela, RBVietnamWorldYemen, Rep.ZambiaZimbabwe Timeline:
This timeline shows a graph from 1970 to 2015 of Sao Tome and Principe. No data until 1969. Number of actual observations by date: 41.
Source name:
World Development Indicators
Source organization:
World Bank staff estimates based data from International Monetary Fund's Direction of Trade database.
Categories, topics:
Private Sector, Trade
Last updated:
apr 23, 2017
Indicators value changes by year
At the date of observation
Value
Absolute change
Change from previous value
jan 1, 1970
100.0
+100.0
0.0%
jan 1, 1971
100.0
0.0
0.0%
jan 1, 1974
100.0
0.0
0.0%
jan 1, 1975
100.0
0.0
0.0%
jan 1, 1976
100.0
0.0
0.0%
jan 1, 1977
100.0
0.0
0.0%
jan 1, 1978
100.0
0.0
0.0%
jan 1, 1982
100.0
0.0
0.0%
jan 1, 1983
100.0
0.0
0.0%
jan 1, 1984
100.0
0.0
0.0%
jan 1, 1985
100.0
0.0
0.0%
jan 1, 1986
100.0
0.0
0.0%
jan 1, 1987
100.0
0.0
0.0%
jan 1, 1988
100.0
0.0
0.0%
jan 1, 1989
100.0
0.0
0.0%
jan 1, 1990
100.0
0.0
0.0%
jan 1, 1991
100.0
0.0
0.0%
jan 1, 1992
100.0
0.0
0.0%
jan 1, 1993
100.0
0.0
0.0%
jan 1, 1994
100.0
0.0
0.0%
jan 1, 1995
7.238
-92.762
-92.76%
jan 1, 1996
16.438
+9.2
127.11%
jan 1, 1997
17.936
+1.498
9.11%
jan 1, 1998
11.591
-6.345
-35.38%
jan 1, 1999
6.271
-5.321
-45.9%
jan 1, 2000
6.063
-0.208
-3.31%
jan 1, 2001
10.931
+4.868
80.3%
jan 1, 2002
9.368
-1.563
-14.3%
jan 1, 2003
9.664
+0.296
3.15%
jan 1, 2004
9.392
-0.272
-2.81%
jan 1, 2005
13.167
+3.776
40.2%
jan 1, 2006
18.81
+5.643
42.85%
jan 1, 2007
13.673
-5.137
-27.31%
jan 1, 2008
15.052
+1.38
10.09%
jan 1, 2009
14.858
-0.194
-1.29%
jan 1, 2010
23.368
+8.509
57.27%
jan 1, 2011
27.84
+4.473
19.14%
jan 1, 2012
15.835
-12.005
-43.12%
jan 1, 2013
18.411
+2.576
16.27%
jan 1, 2014
23.108
+4.697
25.51%
jan 1, 2015
20.668
-2.44
-10.56%
Ranking of countries by current statistics by years


Comments: