29
/
en
AIzaSyAYiBZKx7MnpbEhh9jyipgxe19OcubqV5w
April 1, 2024
142595
Greenland
GRL
true
2
1
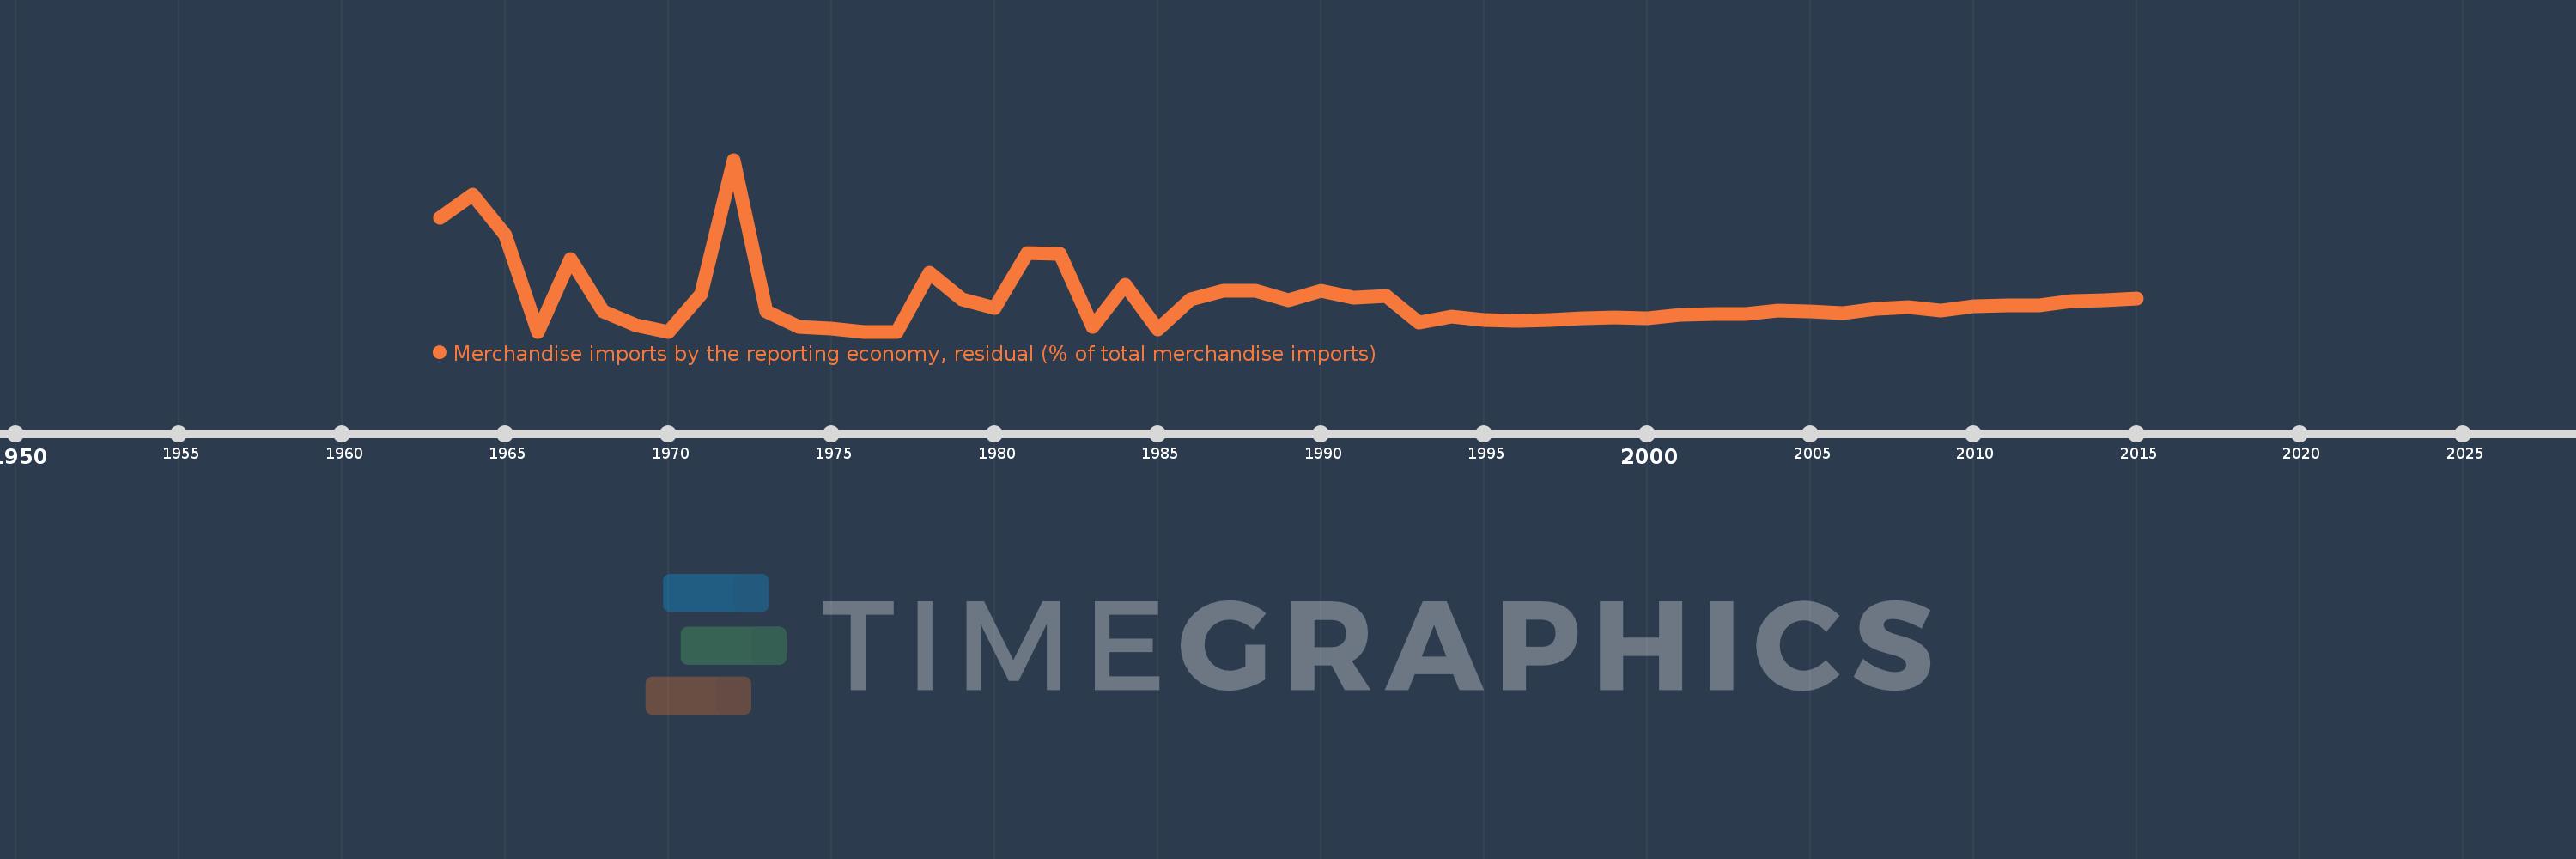
Merchandise imports by the reporting economy, residual (% of total merchandise imports)
2015,2014,2013,2012,2011,2010,2009,2008,2007,2006,2005,2004,2003,2002,2001,2000,1999,1998,1997,1996,1995,1994,1993,1992,1991,1990,1989,1988,1987,1986,1985,1984,1983,1982,1981,1980,1979,1978,1977,1976,1975,1974,1973,1972,1971,1970,1969,1968,1967,1966,1965,1964,1963
This statistics in other country:
AfghanistanAlbaniaAlgeriaAmerican SamoaAngolaAntigua and BarbudaArab WorldArgentinaArmeniaArubaAustraliaAustriaAzerbaijanBahamas, TheBahrainBangladeshBarbadosBelarusBelgiumBelizeBeninBermudaBoliviaBosnia and HerzegovinaBrazilBrunei DarussalamBulgariaBurkina FasoBurundiCabo VerdeCambodiaCameroonCanadaCaribbean small statesCentral African RepublicCentral Europe and the BalticsChadChileChinaColombiaComorosCongo, Dem. Rep.Congo, Rep.Costa RicaCote d'IvoireCroatiaCubaCyprusCzech RepublicDenmarkDjiboutiDominicaDominican RepublicEarly-demographic dividendEast Asia & PacificEast Asia & Pacific (excluding high income)East Asia & Pacific (IDA & IBRD countries)EcuadorEgypt, Arab Rep.El SalvadorEquatorial GuineaEstoniaEthiopiaEuro areaEurope & Central AsiaEurope & Central Asia (excluding high income)Europe & Central Asia (IDA & IBRD countries)European UnionFaroe IslandsFijiFinlandFragile and conflict affected situationsFranceFrench PolynesiaGabonGambia, TheGeorgiaGermanyGhanaGibraltarGreeceGreenlandGrenadaGuamGuatemalaGuineaGuinea-BissauGuyanaHaitiHeavily indebted poor countries (HIPC)High incomeHondurasHong Kong SAR, ChinaHungaryIBRD onlyIcelandIDA & IBRD totalIDA blendIDA onlyIDA totalIndiaIndonesiaIran, Islamic Rep.IraqIrelandIsraelItalyJamaicaJapanJordanKazakhstanKenyaKiribatiKorea, Dem. People’s Rep.Korea, Rep.KosovoKuwaitKyrgyz RepublicLao PDRLate-demographic dividendLatin America & Caribbean Latin America & Caribbean (excluding high income)Latin America & the Caribbean (IDA & IBRD countries)LatviaLeast developed countries: UN classificationLebanonLiberiaLibyaLithuaniaLow & middle incomeLow incomeLower middle incomeLuxembourgMacao SAR, ChinaMacedonia, FYRMadagascarMalawiMalaysiaMaldivesMaliMaltaMauritaniaMauritiusMexicoMiddle East & North AfricaMiddle East & North Africa (excluding high income)Middle East & North Africa (IDA & IBRD countries)Middle incomeMoldovaMongoliaMontenegroMoroccoMozambiqueMyanmarNauruNepalNetherlandsNew CaledoniaNew ZealandNicaraguaNigerNigeriaNorth AmericaNorwayOECD membersOmanOther small statesPacific island small statesPakistanPanamaPapua New GuineaParaguayPeruPhilippinesPolandPortugalPost-demographic dividendPre-demographic dividendQatarRomaniaRussian FederationRwandaSamoaSao Tome and PrincipeSaudi ArabiaSenegalSerbiaSeychellesSierra LeoneSingaporeSlovak RepublicSloveniaSmall statesSolomon IslandsSomaliaSouth AfricaSouth AsiaSouth Asia (IDA & IBRD)SpainSri LankaSt. Kitts and NevisSt. LuciaSt. Vincent and the GrenadinesSub-Saharan Africa Sub-Saharan Africa (excluding high income)Sub-Saharan Africa (IDA & IBRD countries)SudanSurinameSwedenSwitzerlandSyrian Arab RepublicTajikistanTanzaniaThailandTogoTongaTrinidad and TobagoTunisiaTurkeyTurkmenistanTuvaluUgandaUkraineUnited Arab EmiratesUnited KingdomUnited StatesUpper middle incomeUruguayUzbekistanVanuatuVenezuela, RBVietnamWorldYemen, Rep.ZambiaZimbabwe Timeline:
This timeline shows a graph from 1963 to 2015 of Greenland. No data until 1962. Number of actual observations by date: 53.
Source name:
World Development Indicators
Source organization:
World Bank staff estimates based data from International Monetary Fund's Direction of Trade database.
Categories, topics:
Private Sector, Trade
Last updated:
apr 23, 2017
Indicators value changes by year
At the date of observation
Value
Absolute change
Change from previous value
jan 1, 1963
4.955
+4.955
0.0%
jan 1, 1964
5.952
+0.997
20.13%
jan 1, 1965
4.211
-1.742
-29.26%
jan 1, 1966
0.0
-4.211
-100.0%
jan 1, 1967
3.158
+3.158
%
jan 1, 1968
0.875
-2.283
-72.28%
jan 1, 1969
0.272
-0.603
-68.89%
jan 1, 1970
0.0
-0.272
-100.0%
jan 1, 1971
1.607
+1.607
%
jan 1, 1972
7.463
+5.856
364.4%
jan 1, 1973
0.875
-6.588
-88.27%
jan 1, 1974
0.196
-0.679
-77.61%
jan 1, 1975
0.141
-0.055
-27.94%
jan 1, 1976
0.0
-0.141
-100.0%
jan 1, 1978
2.561
+2.561
%
jan 1, 1979
1.398
-1.162
-45.39%
jan 1, 1980
1.044
-0.354
-25.33%
jan 1, 1981
3.431
+2.387
228.56%
jan 1, 1982
3.368
-0.062
-1.81%
jan 1, 1983
0.188
-3.181
-94.43%
jan 1, 1984
2.023
+1.835
977.9%
jan 1, 1985
0.108
-1.915
-94.64%
jan 1, 1986
1.384
+1.275
1.18K%
jan 1, 1987
1.756
+0.372
26.9%
jan 1, 1988
1.772
+0.016
0.88%
jan 1, 1989
1.36
-0.412
-23.26%
jan 1, 1990
1.783
+0.424
31.18%
jan 1, 1991
1.47
-0.313
-17.55%
jan 1, 1992
1.546
+0.075
5.12%
jan 1, 1993
0.395
-1.151
-74.44%
jan 1, 1994
0.651
+0.256
64.69%
jan 1, 1995
0.5
-0.15
-23.12%
jan 1, 1996
0.474
-0.026
-5.25%
jan 1, 1997
0.487
+0.013
2.85%
jan 1, 1998
0.576
+0.088
18.11%
jan 1, 1999
0.606
+0.03
5.27%
jan 1, 2000
0.573
-0.033
-5.51%
jan 1, 2001
0.711
+0.138
24.15%
jan 1, 2002
0.77
+0.059
8.26%
jan 1, 2003
0.763
-0.007
-0.92%
jan 1, 2004
0.92
+0.158
20.66%
jan 1, 2005
0.883
-0.037
-4.02%
jan 1, 2006
0.808
-0.075
-8.52%
jan 1, 2007
0.988
+0.181
22.37%
jan 1, 2008
1.054
+0.065
6.59%
jan 1, 2009
0.919
-0.135
-12.83%
jan 1, 2010
1.096
+0.177
19.29%
jan 1, 2011
1.129
+0.033
3.05%
jan 1, 2012
1.126
-0.003
-0.24%
jan 1, 2013
1.316
+0.19
16.84%
jan 1, 2014
1.365
+0.048
3.67%
jan 1, 2015
1.443
+0.078
5.73%
Ranking of countries by current statistics by years


Comments: