29
/
en
AIzaSyAYiBZKx7MnpbEhh9jyipgxe19OcubqV5w
April 1, 2024
286172
Zambia
ZMB
true
2
1
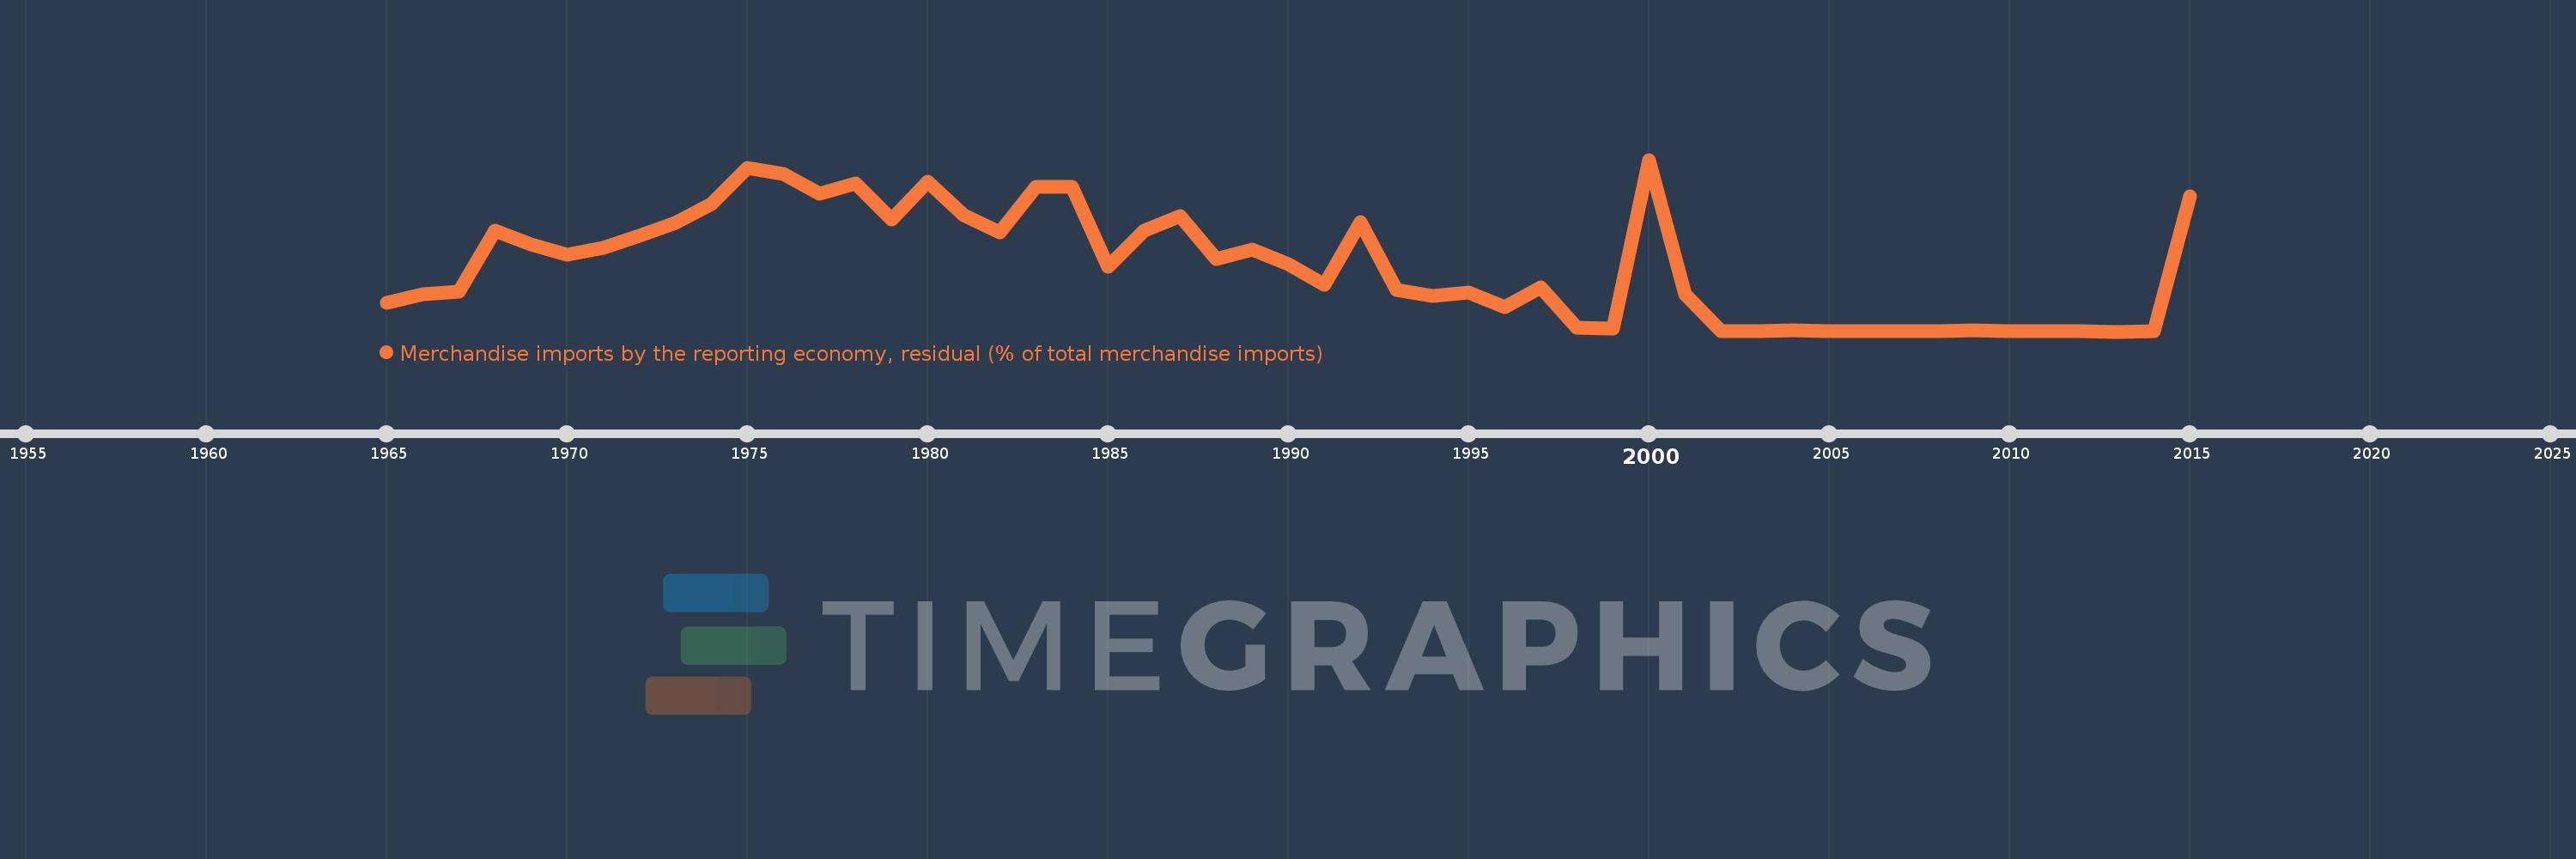
Merchandise imports by the reporting economy, residual (% of total merchandise imports)
2015,2014,2013,2012,2011,2010,2009,2008,2007,2006,2005,2004,2003,2002,2001,2000,1999,1998,1997,1996,1995,1994,1993,1992,1991,1990,1989,1988,1987,1986,1985,1984,1983,1982,1981,1980,1979,1978,1977,1976,1975,1974,1973,1972,1971,1970,1969,1968,1967,1966,1965
This statistics in other country:
AfghanistanAlbaniaAlgeriaAmerican SamoaAngolaAntigua and BarbudaArab WorldArgentinaArmeniaArubaAustraliaAustriaAzerbaijanBahamas, TheBahrainBangladeshBarbadosBelarusBelgiumBelizeBeninBermudaBoliviaBosnia and HerzegovinaBrazilBrunei DarussalamBulgariaBurkina FasoBurundiCabo VerdeCambodiaCameroonCanadaCaribbean small statesCentral African RepublicCentral Europe and the BalticsChadChileChinaColombiaComorosCongo, Dem. Rep.Congo, Rep.Costa RicaCote d'IvoireCroatiaCubaCyprusCzech RepublicDenmarkDjiboutiDominicaDominican RepublicEarly-demographic dividendEast Asia & PacificEast Asia & Pacific (excluding high income)East Asia & Pacific (IDA & IBRD countries)EcuadorEgypt, Arab Rep.El SalvadorEquatorial GuineaEstoniaEthiopiaEuro areaEurope & Central AsiaEurope & Central Asia (excluding high income)Europe & Central Asia (IDA & IBRD countries)European UnionFaroe IslandsFijiFinlandFragile and conflict affected situationsFranceFrench PolynesiaGabonGambia, TheGeorgiaGermanyGhanaGibraltarGreeceGreenlandGrenadaGuamGuatemalaGuineaGuinea-BissauGuyanaHaitiHeavily indebted poor countries (HIPC)High incomeHondurasHong Kong SAR, ChinaHungaryIBRD onlyIcelandIDA & IBRD totalIDA blendIDA onlyIDA totalIndiaIndonesiaIran, Islamic Rep.IraqIrelandIsraelItalyJamaicaJapanJordanKazakhstanKenyaKiribatiKorea, Dem. People’s Rep.Korea, Rep.KosovoKuwaitKyrgyz RepublicLao PDRLate-demographic dividendLatin America & Caribbean Latin America & Caribbean (excluding high income)Latin America & the Caribbean (IDA & IBRD countries)LatviaLeast developed countries: UN classificationLebanonLiberiaLibyaLithuaniaLow & middle incomeLow incomeLower middle incomeLuxembourgMacao SAR, ChinaMacedonia, FYRMadagascarMalawiMalaysiaMaldivesMaliMaltaMauritaniaMauritiusMexicoMiddle East & North AfricaMiddle East & North Africa (excluding high income)Middle East & North Africa (IDA & IBRD countries)Middle incomeMoldovaMongoliaMontenegroMoroccoMozambiqueMyanmarNauruNepalNetherlandsNew CaledoniaNew ZealandNicaraguaNigerNigeriaNorth AmericaNorwayOECD membersOmanOther small statesPacific island small statesPakistanPanamaPapua New GuineaParaguayPeruPhilippinesPolandPortugalPost-demographic dividendPre-demographic dividendQatarRomaniaRussian FederationRwandaSamoaSao Tome and PrincipeSaudi ArabiaSenegalSerbiaSeychellesSierra LeoneSingaporeSlovak RepublicSloveniaSmall statesSolomon IslandsSomaliaSouth AfricaSouth AsiaSouth Asia (IDA & IBRD)SpainSri LankaSt. Kitts and NevisSt. LuciaSt. Vincent and the GrenadinesSub-Saharan Africa Sub-Saharan Africa (excluding high income)Sub-Saharan Africa (IDA & IBRD countries)SudanSurinameSwedenSwitzerlandSyrian Arab RepublicTajikistanTanzaniaThailandTogoTongaTrinidad and TobagoTunisiaTurkeyTurkmenistanTuvaluUgandaUkraineUnited Arab EmiratesUnited KingdomUnited StatesUpper middle incomeUruguayUzbekistanVanuatuVenezuela, RBVietnamWorldYemen, Rep.ZambiaZimbabwe Timeline:
This timeline shows a graph from 1965 to 2015 of Zambia. No data until 1964. Number of actual observations by date: 51.
Source name:
World Development Indicators
Source organization:
World Bank staff estimates based data from International Monetary Fund's Direction of Trade database.
Categories, topics:
Private Sector, Trade
Last updated:
apr 23, 2017
Indicators value changes by year
At the date of observation
Value
Absolute change
Change from previous value
jan 1, 1965
0.734
+0.734
0.0%
jan 1, 1966
0.954
+0.22
29.95%
jan 1, 1967
1.021
+0.068
7.09%
jan 1, 1968
2.611
+1.59
155.64%
jan 1, 1969
2.248
-0.363
-13.89%
jan 1, 1970
1.977
-0.271
-12.08%
jan 1, 1971
2.152
+0.176
8.9%
jan 1, 1972
2.478
+0.326
15.14%
jan 1, 1973
2.792
+0.314
12.67%
jan 1, 1974
3.278
+0.486
17.41%
jan 1, 1975
4.212
+0.933
28.47%
jan 1, 1976
4.065
-0.147
-3.49%
jan 1, 1977
3.544
-0.521
-12.81%
jan 1, 1978
3.813
+0.269
7.59%
jan 1, 1979
2.884
-0.93
-24.38%
jan 1, 1980
3.86
+0.976
33.85%
jan 1, 1981
2.997
-0.862
-22.34%
jan 1, 1982
2.562
-0.435
-14.52%
jan 1, 1983
3.734
+1.172
45.76%
jan 1, 1984
3.734
0.0
0.0%
jan 1, 1985
1.678
-2.056
-55.06%
jan 1, 1986
2.609
+0.931
55.5%
jan 1, 1987
2.974
+0.364
13.95%
jan 1, 1988
1.873
-1.1
-37.0%
jan 1, 1989
2.119
+0.246
13.12%
jan 1, 1990
1.736
-0.383
-18.06%
jan 1, 1991
1.202
-0.534
-30.77%
jan 1, 1992
2.817
+1.615
134.31%
jan 1, 1993
1.082
-1.735
-61.59%
jan 1, 1994
0.926
-0.156
-14.44%
jan 1, 1995
0.999
+0.074
7.94%
jan 1, 1996
0.633
-0.366
-36.67%
jan 1, 1997
1.141
+0.508
80.3%
jan 1, 1998
0.1
-1.041
-91.21%
jan 1, 1999
0.081
-0.02
-19.58%
jan 1, 2000
4.429
+4.348
5.39K%
jan 1, 2001
0.956
-3.473
-78.42%
jan 1, 2002
0.02
-0.935
-97.86%
jan 1, 2003
0.016
-0.004
-20.61%
jan 1, 2004
0.031
+0.015
92.99%
jan 1, 2005
0.008
-0.023
-74.1%
jan 1, 2006
0.007
-0.001
-17.38%
jan 1, 2007
0.012
+0.006
84.3%
jan 1, 2008
0.004
-0.008
-64.46%
jan 1, 2009
0.029
+0.025
565.43%
jan 1, 2010
0.007
-0.022
-76.09%
jan 1, 2011
0.009
+0.002
34.09%
jan 1, 2012
0.023
+0.013
143.95%
jan 1, 2013
0.002
-0.021
-90.09%
jan 1, 2014
0.011
+0.009
386.23%
jan 1, 2015
3.496
+3.484
31.63K%
Ranking of countries by current statistics by years


Comments: