29
/
en
AIzaSyAYiBZKx7MnpbEhh9jyipgxe19OcubqV5w
April 1, 2024
100200
Cameroon
CMR
true
2
1
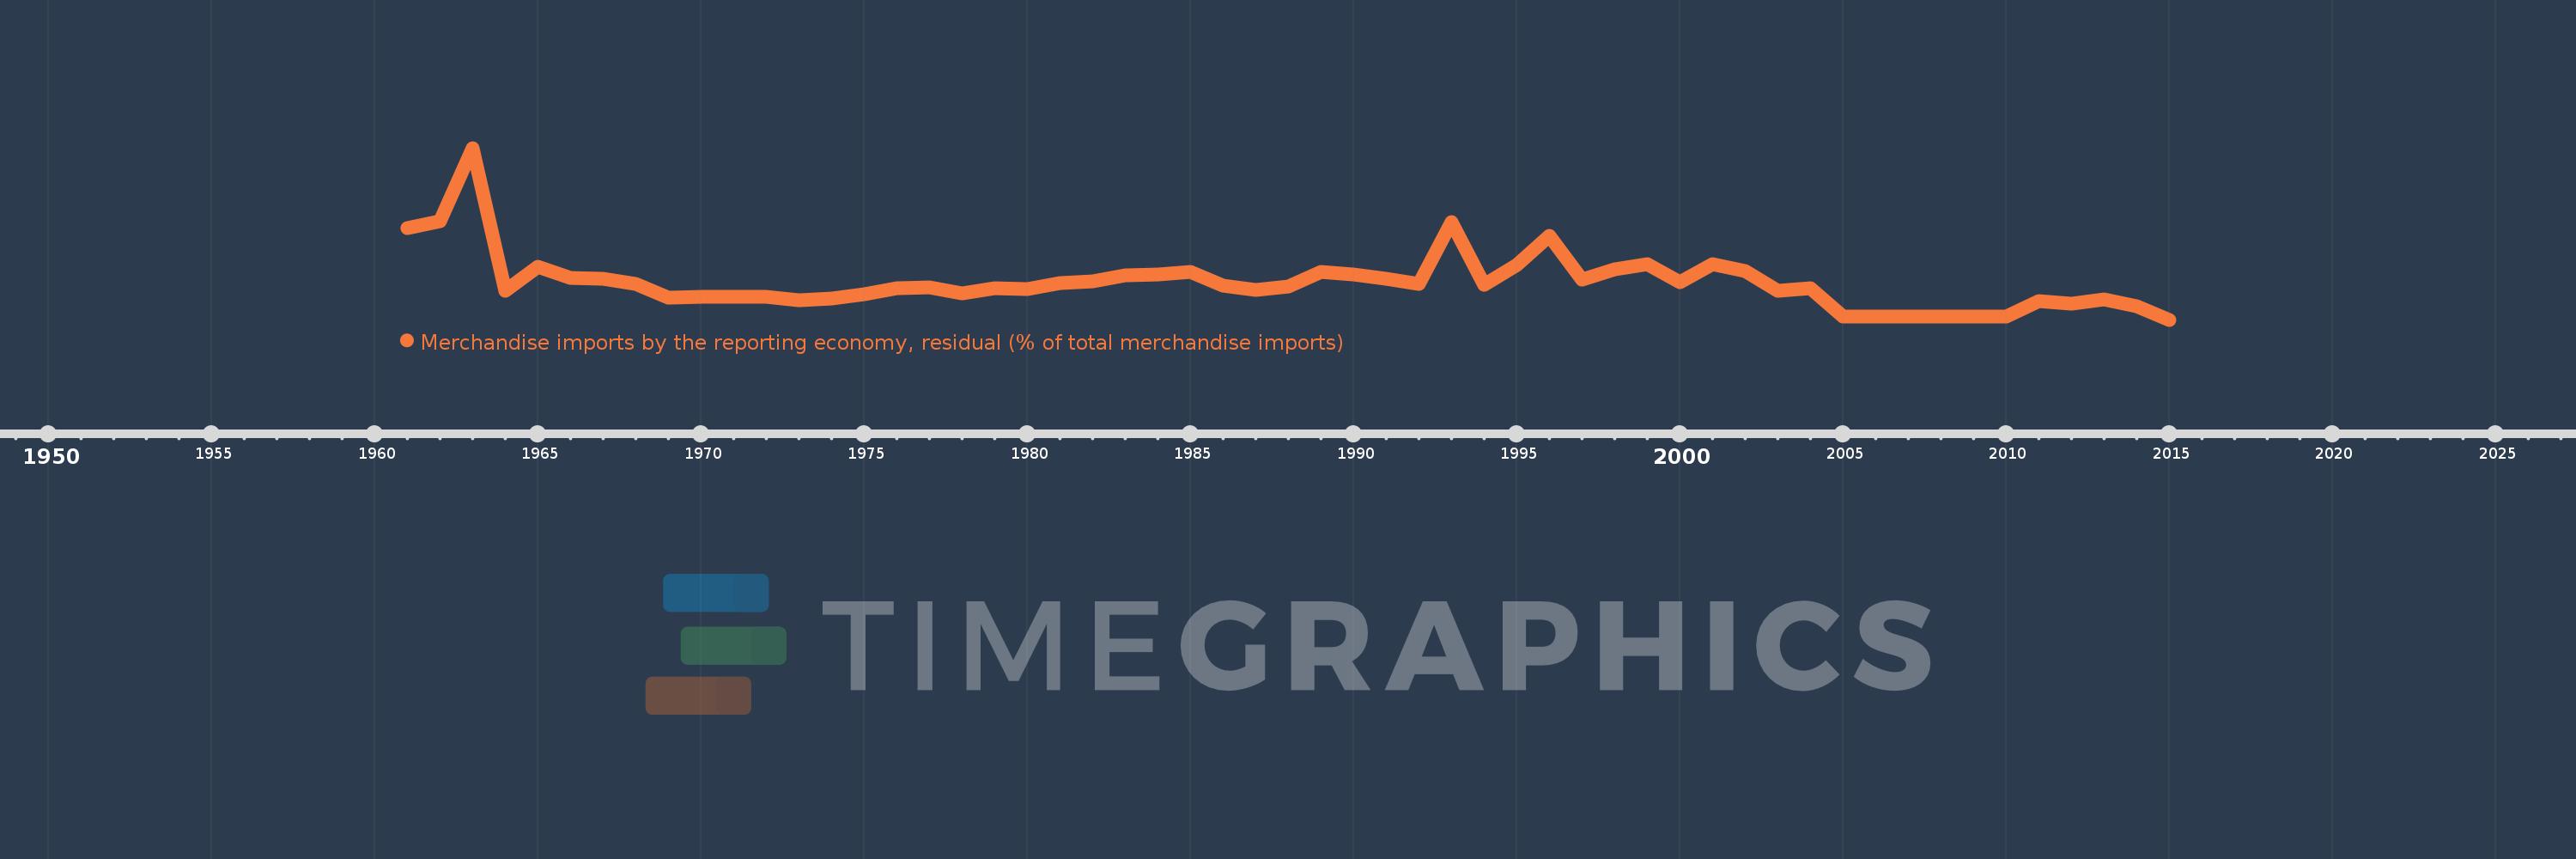
Merchandise imports by the reporting economy, residual (% of total merchandise imports)
2015,2014,2013,2012,2011,2010,2009,2008,2007,2006,2005,2004,2003,2002,2001,2000,1999,1998,1997,1996,1995,1994,1993,1992,1991,1990,1989,1988,1987,1986,1985,1984,1983,1982,1981,1980,1979,1978,1977,1976,1975,1974,1973,1972,1971,1970,1969,1968,1967,1966,1965,1964,1963,1962,1961
This statistics in other country:
AfghanistanAlbaniaAlgeriaAmerican SamoaAngolaAntigua and BarbudaArab WorldArgentinaArmeniaArubaAustraliaAustriaAzerbaijanBahamas, TheBahrainBangladeshBarbadosBelarusBelgiumBelizeBeninBermudaBoliviaBosnia and HerzegovinaBrazilBrunei DarussalamBulgariaBurkina FasoBurundiCabo VerdeCambodiaCameroonCanadaCaribbean small statesCentral African RepublicCentral Europe and the BalticsChadChileChinaColombiaComorosCongo, Dem. Rep.Congo, Rep.Costa RicaCote d'IvoireCroatiaCubaCyprusCzech RepublicDenmarkDjiboutiDominicaDominican RepublicEarly-demographic dividendEast Asia & PacificEast Asia & Pacific (excluding high income)East Asia & Pacific (IDA & IBRD countries)EcuadorEgypt, Arab Rep.El SalvadorEquatorial GuineaEstoniaEthiopiaEuro areaEurope & Central AsiaEurope & Central Asia (excluding high income)Europe & Central Asia (IDA & IBRD countries)European UnionFaroe IslandsFijiFinlandFragile and conflict affected situationsFranceFrench PolynesiaGabonGambia, TheGeorgiaGermanyGhanaGibraltarGreeceGreenlandGrenadaGuamGuatemalaGuineaGuinea-BissauGuyanaHaitiHeavily indebted poor countries (HIPC)High incomeHondurasHong Kong SAR, ChinaHungaryIBRD onlyIcelandIDA & IBRD totalIDA blendIDA onlyIDA totalIndiaIndonesiaIran, Islamic Rep.IraqIrelandIsraelItalyJamaicaJapanJordanKazakhstanKenyaKiribatiKorea, Dem. People’s Rep.Korea, Rep.KosovoKuwaitKyrgyz RepublicLao PDRLate-demographic dividendLatin America & Caribbean Latin America & Caribbean (excluding high income)Latin America & the Caribbean (IDA & IBRD countries)LatviaLeast developed countries: UN classificationLebanonLiberiaLibyaLithuaniaLow & middle incomeLow incomeLower middle incomeLuxembourgMacao SAR, ChinaMacedonia, FYRMadagascarMalawiMalaysiaMaldivesMaliMaltaMauritaniaMauritiusMexicoMiddle East & North AfricaMiddle East & North Africa (excluding high income)Middle East & North Africa (IDA & IBRD countries)Middle incomeMoldovaMongoliaMontenegroMoroccoMozambiqueMyanmarNauruNepalNetherlandsNew CaledoniaNew ZealandNicaraguaNigerNigeriaNorth AmericaNorwayOECD membersOmanOther small statesPacific island small statesPakistanPanamaPapua New GuineaParaguayPeruPhilippinesPolandPortugalPost-demographic dividendPre-demographic dividendQatarRomaniaRussian FederationRwandaSamoaSao Tome and PrincipeSaudi ArabiaSenegalSerbiaSeychellesSierra LeoneSingaporeSlovak RepublicSloveniaSmall statesSolomon IslandsSomaliaSouth AfricaSouth AsiaSouth Asia (IDA & IBRD)SpainSri LankaSt. Kitts and NevisSt. LuciaSt. Vincent and the GrenadinesSub-Saharan Africa Sub-Saharan Africa (excluding high income)Sub-Saharan Africa (IDA & IBRD countries)SudanSurinameSwedenSwitzerlandSyrian Arab RepublicTajikistanTanzaniaThailandTogoTongaTrinidad and TobagoTunisiaTurkeyTurkmenistanTuvaluUgandaUkraineUnited Arab EmiratesUnited KingdomUnited StatesUpper middle incomeUruguayUzbekistanVanuatuVenezuela, RBVietnamWorldYemen, Rep.ZambiaZimbabwe Timeline:
This timeline shows a graph from 1961 to 2015 of Cameroon. No data until 1960. Number of actual observations by date: 55.
Source name:
World Development Indicators
Source organization:
World Bank staff estimates based data from International Monetary Fund's Direction of Trade database.
Categories, topics:
Private Sector, Trade
Last updated:
apr 23, 2017
Indicators value changes by year
Maximum:
28.389
jan 1, 1963
At the date of observation
Value
Absolute change
Change from previous value
jan 1, 1961
15.101
+15.101
0.0%
jan 1, 1962
16.264
+1.163
7.7%
jan 1, 1963
28.389
+12.125
74.55%
jan 1, 1964
4.819
-23.57
-83.02%
jan 1, 1965
8.793
+3.974
82.46%
jan 1, 1966
6.984
-1.809
-20.58%
jan 1, 1967
6.712
-0.271
-3.88%
jan 1, 1968
5.989
-0.724
-10.78%
jan 1, 1969
3.611
-2.378
-39.71%
jan 1, 1970
3.746
+0.136
3.75%
jan 1, 1971
3.766
+0.02
0.53%
jan 1, 1972
3.788
+0.022
0.59%
jan 1, 1973
3.278
-0.51
-13.46%
jan 1, 1974
3.51
+0.231
7.06%
jan 1, 1975
4.17
+0.66
18.81%
jan 1, 1976
5.192
+1.022
24.51%
jan 1, 1977
5.31
+0.118
2.26%
jan 1, 1978
4.39
-0.919
-17.31%
jan 1, 1979
5.246
+0.856
19.5%
jan 1, 1980
5.023
-0.224
-4.27%
jan 1, 1981
6.042
+1.02
20.3%
jan 1, 1982
6.345
+0.303
5.01%
jan 1, 1983
7.274
+0.929
14.65%
jan 1, 1984
7.532
+0.258
3.54%
jan 1, 1985
7.964
+0.432
5.74%
jan 1, 1986
5.685
-2.28
-28.62%
jan 1, 1987
4.995
-0.689
-12.13%
jan 1, 1988
5.436
+0.441
8.82%
jan 1, 1989
7.922
+2.486
45.74%
jan 1, 1990
7.515
-0.407
-5.14%
jan 1, 1991
6.781
-0.734
-9.77%
jan 1, 1992
5.916
-0.864
-12.75%
jan 1, 1993
16.136
+10.219
172.72%
jan 1, 1994
5.849
-10.287
-63.75%
jan 1, 1995
9.086
+3.237
55.34%
jan 1, 1996
13.831
+4.746
52.23%
jan 1, 1997
6.627
-7.205
-52.09%
jan 1, 1998
8.291
+1.665
25.12%
jan 1, 1999
9.243
+0.952
11.48%
jan 1, 2000
6.208
-3.035
-32.83%
jan 1, 2001
9.205
+2.997
48.28%
jan 1, 2002
7.995
-1.21
-13.15%
jan 1, 2003
4.805
-3.19
-39.9%
jan 1, 2004
5.209
+0.404
8.41%
jan 1, 2005
0.505
-4.704
-90.3%
jan 1, 2006
0.513
+0.007
1.48%
jan 1, 2007
0.545
+0.033
6.35%
jan 1, 2008
0.546
+0.0
0.07%
jan 1, 2009
0.518
-0.028
-5.04%
jan 1, 2010
0.501
-0.017
-3.24%
jan 1, 2011
3.043
+2.542
506.98%
jan 1, 2012
2.639
-0.405
-13.3%
jan 1, 2013
3.332
+0.694
26.29%
jan 1, 2014
2.226
-1.106
-33.2%
jan 1, 2015
0.004
-2.223
-99.84%
Ranking of countries by current statistics by years


Comments: