29
/
en
AIzaSyAYiBZKx7MnpbEhh9jyipgxe19OcubqV5w
April 1, 2024
152793
Hungary
HUN
true
2
1
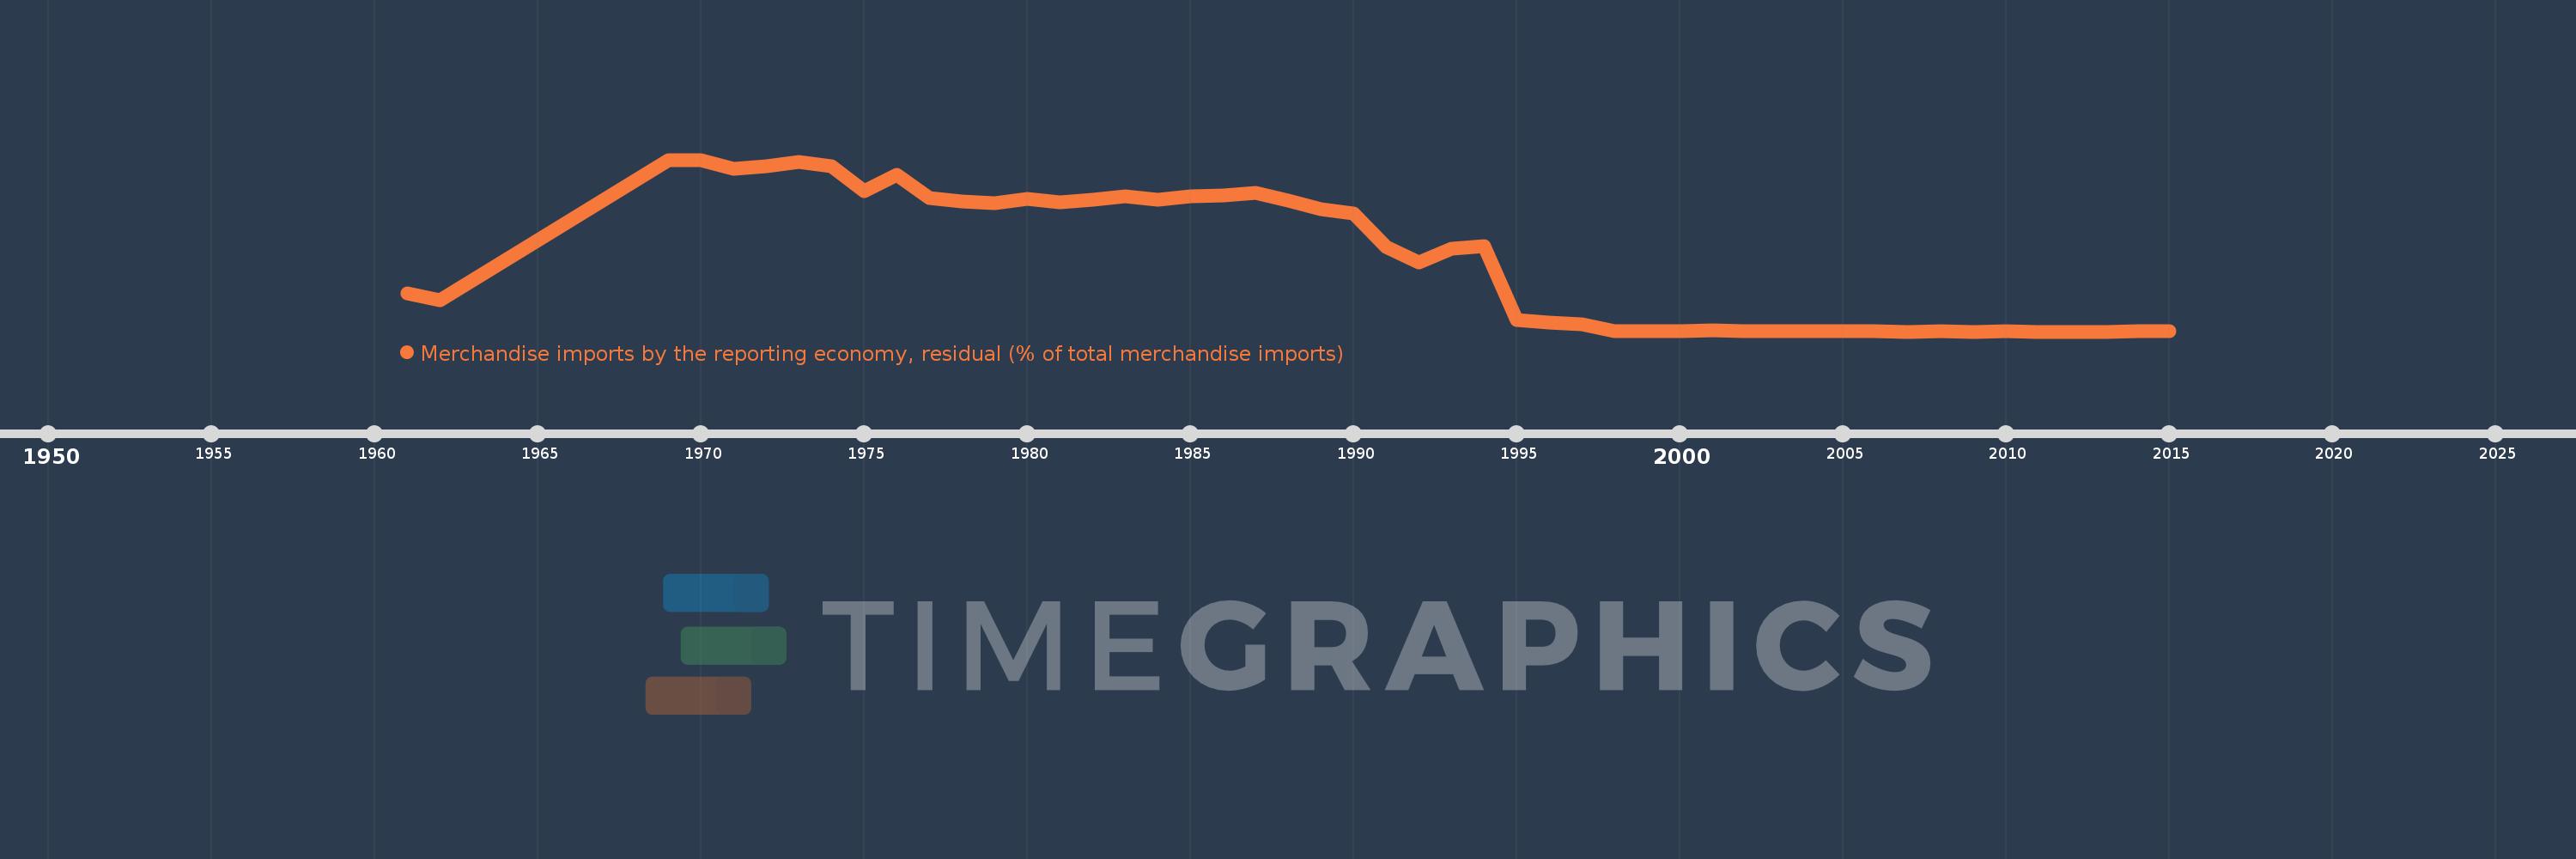
Merchandise imports by the reporting economy, residual (% of total merchandise imports)
2015,2014,2013,2012,2011,2010,2009,2008,2007,2006,2005,2004,2003,2002,2001,2000,1999,1998,1997,1996,1995,1994,1993,1992,1991,1990,1989,1988,1987,1986,1985,1984,1983,1982,1981,1980,1979,1978,1977,1976,1975,1974,1973,1972,1971,1970,1969,1962,1961
This statistics in other country:
AfghanistanAlbaniaAlgeriaAmerican SamoaAngolaAntigua and BarbudaArab WorldArgentinaArmeniaArubaAustraliaAustriaAzerbaijanBahamas, TheBahrainBangladeshBarbadosBelarusBelgiumBelizeBeninBermudaBoliviaBosnia and HerzegovinaBrazilBrunei DarussalamBulgariaBurkina FasoBurundiCabo VerdeCambodiaCameroonCanadaCaribbean small statesCentral African RepublicCentral Europe and the BalticsChadChileChinaColombiaComorosCongo, Dem. Rep.Congo, Rep.Costa RicaCote d'IvoireCroatiaCubaCyprusCzech RepublicDenmarkDjiboutiDominicaDominican RepublicEarly-demographic dividendEast Asia & PacificEast Asia & Pacific (excluding high income)East Asia & Pacific (IDA & IBRD countries)EcuadorEgypt, Arab Rep.El SalvadorEquatorial GuineaEstoniaEthiopiaEuro areaEurope & Central AsiaEurope & Central Asia (excluding high income)Europe & Central Asia (IDA & IBRD countries)European UnionFaroe IslandsFijiFinlandFragile and conflict affected situationsFranceFrench PolynesiaGabonGambia, TheGeorgiaGermanyGhanaGibraltarGreeceGreenlandGrenadaGuamGuatemalaGuineaGuinea-BissauGuyanaHaitiHeavily indebted poor countries (HIPC)High incomeHondurasHong Kong SAR, ChinaHungaryIBRD onlyIcelandIDA & IBRD totalIDA blendIDA onlyIDA totalIndiaIndonesiaIran, Islamic Rep.IraqIrelandIsraelItalyJamaicaJapanJordanKazakhstanKenyaKiribatiKorea, Dem. People’s Rep.Korea, Rep.KosovoKuwaitKyrgyz RepublicLao PDRLate-demographic dividendLatin America & Caribbean Latin America & Caribbean (excluding high income)Latin America & the Caribbean (IDA & IBRD countries)LatviaLeast developed countries: UN classificationLebanonLiberiaLibyaLithuaniaLow & middle incomeLow incomeLower middle incomeLuxembourgMacao SAR, ChinaMacedonia, FYRMadagascarMalawiMalaysiaMaldivesMaliMaltaMauritaniaMauritiusMexicoMiddle East & North AfricaMiddle East & North Africa (excluding high income)Middle East & North Africa (IDA & IBRD countries)Middle incomeMoldovaMongoliaMontenegroMoroccoMozambiqueMyanmarNauruNepalNetherlandsNew CaledoniaNew ZealandNicaraguaNigerNigeriaNorth AmericaNorwayOECD membersOmanOther small statesPacific island small statesPakistanPanamaPapua New GuineaParaguayPeruPhilippinesPolandPortugalPost-demographic dividendPre-demographic dividendQatarRomaniaRussian FederationRwandaSamoaSao Tome and PrincipeSaudi ArabiaSenegalSerbiaSeychellesSierra LeoneSingaporeSlovak RepublicSloveniaSmall statesSolomon IslandsSomaliaSouth AfricaSouth AsiaSouth Asia (IDA & IBRD)SpainSri LankaSt. Kitts and NevisSt. LuciaSt. Vincent and the GrenadinesSub-Saharan Africa Sub-Saharan Africa (excluding high income)Sub-Saharan Africa (IDA & IBRD countries)SudanSurinameSwedenSwitzerlandSyrian Arab RepublicTajikistanTanzaniaThailandTogoTongaTrinidad and TobagoTunisiaTurkeyTurkmenistanTuvaluUgandaUkraineUnited Arab EmiratesUnited KingdomUnited StatesUpper middle incomeUruguayUzbekistanVanuatuVenezuela, RBVietnamWorldYemen, Rep.ZambiaZimbabwe Timeline:
This timeline shows a graph from 1961 to 2015 of Hungary. No data until 1960. Number of actual observations by date: 49.
Source name:
World Development Indicators
Source organization:
World Bank staff estimates based data from International Monetary Fund's Direction of Trade database.
Categories, topics:
Private Sector, Trade
Last updated:
apr 23, 2017
Indicators value changes by year
Maximum:
61.077
jan 1, 1969
At the date of observation
Value
Absolute change
Change from previous value
jan 1, 1961
13.476
+13.476
0.0%
jan 1, 1962
11.111
-2.365
-17.55%
jan 1, 1969
61.077
+49.966
449.71%
jan 1, 1970
60.887
-0.19
-0.31%
jan 1, 1971
58.005
-2.882
-4.73%
jan 1, 1972
58.682
+0.677
1.17%
jan 1, 1973
60.462
+1.781
3.03%
jan 1, 1974
58.738
-1.724
-2.85%
jan 1, 1975
49.887
-8.851
-15.07%
jan 1, 1976
55.839
+5.952
11.93%
jan 1, 1977
47.441
-8.398
-15.04%
jan 1, 1978
46.345
-1.096
-2.31%
jan 1, 1979
45.571
-0.774
-1.67%
jan 1, 1980
47.317
+1.745
3.83%
jan 1, 1981
45.824
-1.492
-3.15%
jan 1, 1982
46.831
+1.007
2.2%
jan 1, 1983
48.111
+1.28
2.73%
jan 1, 1984
47.002
-1.109
-2.3%
jan 1, 1985
48.047
+1.044
2.22%
jan 1, 1986
48.441
+0.394
0.82%
jan 1, 1987
49.418
+0.978
2.02%
jan 1, 1988
46.714
-2.704
-5.47%
jan 1, 1989
43.459
-3.256
-6.97%
jan 1, 1990
42.019
-1.44
-3.31%
jan 1, 1991
29.968
-12.051
-28.68%
jan 1, 1992
24.505
-5.463
-18.23%
jan 1, 1993
29.497
+4.992
20.37%
jan 1, 1994
30.529
+1.032
3.5%
jan 1, 1995
4.071
-26.458
-86.66%
jan 1, 1996
3.322
-0.749
-18.4%
jan 1, 1997
2.73
-0.592
-17.83%
jan 1, 1998
0.284
-2.446
-89.59%
jan 1, 1999
0.238
-0.046
-16.27%
jan 1, 2000
0.094
-0.144
-60.46%
jan 1, 2001
0.512
+0.418
443.93%
jan 1, 2002
0.166
-0.346
-67.58%
jan 1, 2003
0.179
+0.013
7.72%
jan 1, 2004
0.158
-0.021
-11.86%
jan 1, 2005
0.007
-0.15
-95.39%
jan 1, 2006
0.095
+0.087
1.2K%
jan 1, 2007
0.0
-0.094
-99.52%
jan 1, 2008
0.002
+0.002
392.55%
jan 1, 2009
0.0
-0.002
-77.82%
jan 1, 2010
0.001
+0.001
157.75%
jan 1, 2011
0.0
-0.001
-89.78%
jan 1, 2012
0.0
+0.0
113.22%
jan 1, 2013
0.0
0.0
-39.56%
jan 1, 2014
0.292
+0.292
172.4K%
jan 1, 2015
0.014
-0.279
-95.31%
Ranking of countries by current statistics by years


Comments: