29
/
en
AIzaSyAYiBZKx7MnpbEhh9jyipgxe19OcubqV5w
April 1, 2024
96389
Burundi
BDI
true
2
1
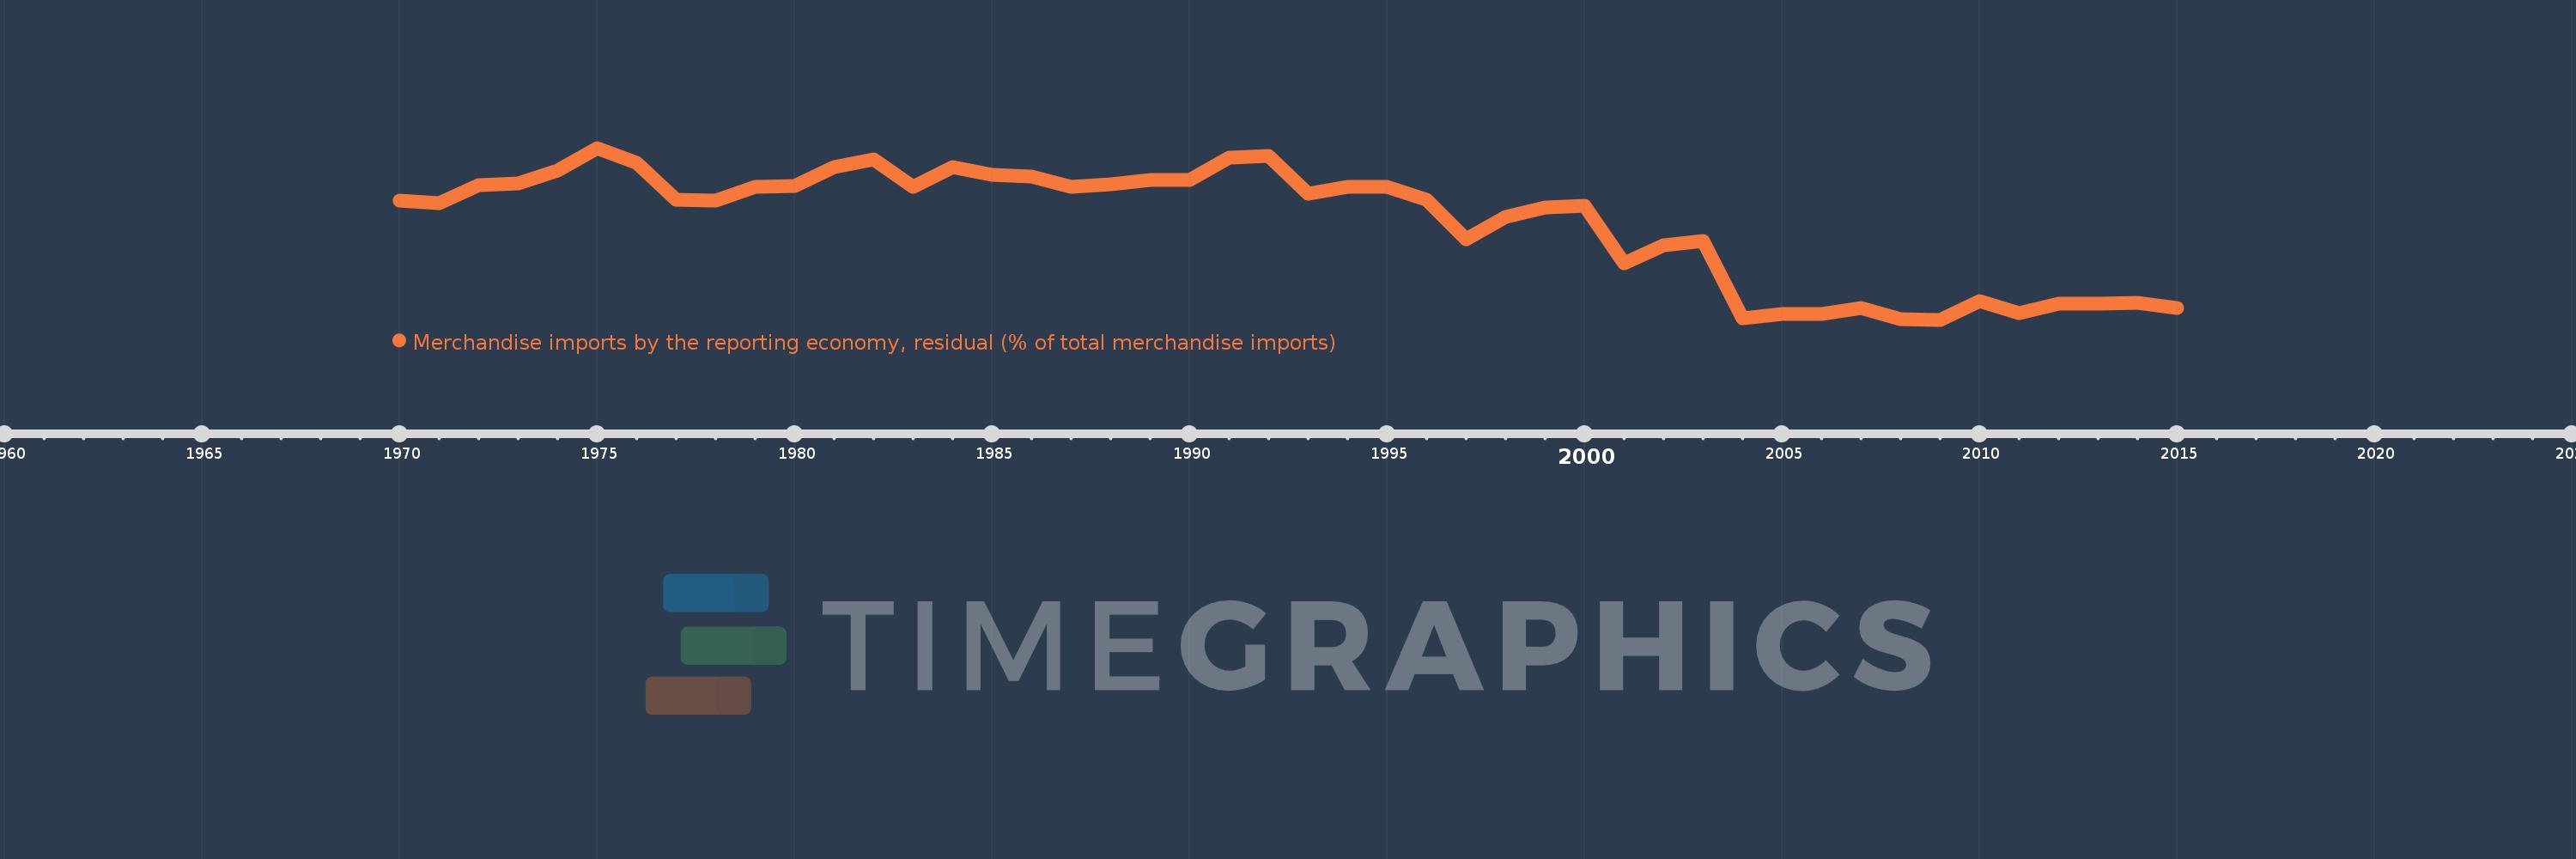
Merchandise imports by the reporting economy, residual (% of total merchandise imports)
2015,2014,2013,2012,2011,2010,2009,2008,2007,2006,2005,2004,2003,2002,2001,2000,1999,1998,1997,1996,1995,1994,1993,1992,1991,1990,1989,1988,1987,1986,1985,1984,1983,1982,1981,1980,1979,1978,1977,1976,1975,1974,1973,1972,1971,1970
This statistics in other country:
AfghanistanAlbaniaAlgeriaAmerican SamoaAngolaAntigua and BarbudaArab WorldArgentinaArmeniaArubaAustraliaAustriaAzerbaijanBahamas, TheBahrainBangladeshBarbadosBelarusBelgiumBelizeBeninBermudaBoliviaBosnia and HerzegovinaBrazilBrunei DarussalamBulgariaBurkina FasoBurundiCabo VerdeCambodiaCameroonCanadaCaribbean small statesCentral African RepublicCentral Europe and the BalticsChadChileChinaColombiaComorosCongo, Dem. Rep.Congo, Rep.Costa RicaCote d'IvoireCroatiaCubaCyprusCzech RepublicDenmarkDjiboutiDominicaDominican RepublicEarly-demographic dividendEast Asia & PacificEast Asia & Pacific (excluding high income)East Asia & Pacific (IDA & IBRD countries)EcuadorEgypt, Arab Rep.El SalvadorEquatorial GuineaEstoniaEthiopiaEuro areaEurope & Central AsiaEurope & Central Asia (excluding high income)Europe & Central Asia (IDA & IBRD countries)European UnionFaroe IslandsFijiFinlandFragile and conflict affected situationsFranceFrench PolynesiaGabonGambia, TheGeorgiaGermanyGhanaGibraltarGreeceGreenlandGrenadaGuamGuatemalaGuineaGuinea-BissauGuyanaHaitiHeavily indebted poor countries (HIPC)High incomeHondurasHong Kong SAR, ChinaHungaryIBRD onlyIcelandIDA & IBRD totalIDA blendIDA onlyIDA totalIndiaIndonesiaIran, Islamic Rep.IraqIrelandIsraelItalyJamaicaJapanJordanKazakhstanKenyaKiribatiKorea, Dem. People’s Rep.Korea, Rep.KosovoKuwaitKyrgyz RepublicLao PDRLate-demographic dividendLatin America & Caribbean Latin America & Caribbean (excluding high income)Latin America & the Caribbean (IDA & IBRD countries)LatviaLeast developed countries: UN classificationLebanonLiberiaLibyaLithuaniaLow & middle incomeLow incomeLower middle incomeLuxembourgMacao SAR, ChinaMacedonia, FYRMadagascarMalawiMalaysiaMaldivesMaliMaltaMauritaniaMauritiusMexicoMiddle East & North AfricaMiddle East & North Africa (excluding high income)Middle East & North Africa (IDA & IBRD countries)Middle incomeMoldovaMongoliaMontenegroMoroccoMozambiqueMyanmarNauruNepalNetherlandsNew CaledoniaNew ZealandNicaraguaNigerNigeriaNorth AmericaNorwayOECD membersOmanOther small statesPacific island small statesPakistanPanamaPapua New GuineaParaguayPeruPhilippinesPolandPortugalPost-demographic dividendPre-demographic dividendQatarRomaniaRussian FederationRwandaSamoaSao Tome and PrincipeSaudi ArabiaSenegalSerbiaSeychellesSierra LeoneSingaporeSlovak RepublicSloveniaSmall statesSolomon IslandsSomaliaSouth AfricaSouth AsiaSouth Asia (IDA & IBRD)SpainSri LankaSt. Kitts and NevisSt. LuciaSt. Vincent and the GrenadinesSub-Saharan Africa Sub-Saharan Africa (excluding high income)Sub-Saharan Africa (IDA & IBRD countries)SudanSurinameSwedenSwitzerlandSyrian Arab RepublicTajikistanTanzaniaThailandTogoTongaTrinidad and TobagoTunisiaTurkeyTurkmenistanTuvaluUgandaUkraineUnited Arab EmiratesUnited KingdomUnited StatesUpper middle incomeUruguayUzbekistanVanuatuVenezuela, RBVietnamWorldYemen, Rep.ZambiaZimbabwe Timeline:
This timeline shows a graph from 1970 to 2015 of Burundi. No data until 1969. Number of actual observations by date: 46.
Source name:
World Development Indicators
Source organization:
World Bank staff estimates based data from International Monetary Fund's Direction of Trade database.
Categories, topics:
Private Sector, Trade
Last updated:
apr 23, 2017
Indicators value changes by year
Maximum:
49.078
jan 1, 1975
At the date of observation
Value
Absolute change
Change from previous value
jan 1, 1970
36.406
+36.406
0.0%
jan 1, 1971
35.874
-0.531
-1.46%
jan 1, 1972
40.134
+4.259
11.87%
jan 1, 1973
40.575
+0.441
1.1%
jan 1, 1974
43.59
+3.015
7.43%
jan 1, 1975
49.078
+5.488
12.59%
jan 1, 1976
45.589
-3.489
-7.11%
jan 1, 1977
36.616
-8.973
-19.68%
jan 1, 1978
36.352
-0.264
-0.72%
jan 1, 1979
39.691
+3.339
9.18%
jan 1, 1980
40.028
+0.337
0.85%
jan 1, 1981
44.509
+4.481
11.19%
jan 1, 1982
46.414
+1.904
4.28%
jan 1, 1983
39.751
-6.662
-14.35%
jan 1, 1984
44.383
+4.632
11.65%
jan 1, 1985
42.641
-1.742
-3.93%
jan 1, 1986
42.286
-0.354
-0.83%
jan 1, 1987
39.759
-2.527
-5.98%
jan 1, 1988
40.373
+0.614
1.54%
jan 1, 1989
41.321
+0.948
2.35%
jan 1, 1990
41.297
-0.024
-0.06%
jan 1, 1991
46.746
+5.449
13.2%
jan 1, 1992
47.109
+0.363
0.78%
jan 1, 1993
38.135
-8.975
-19.05%
jan 1, 1994
39.624
+1.49
3.91%
jan 1, 1995
39.774
+0.149
0.38%
jan 1, 1996
36.702
-3.072
-7.72%
jan 1, 1997
27.183
-9.519
-25.94%
jan 1, 1998
32.558
+5.375
19.77%
jan 1, 1999
34.748
+2.19
6.73%
jan 1, 2000
35.157
+0.409
1.18%
jan 1, 2001
21.4
-13.757
-39.13%
jan 1, 2002
25.587
+4.187
19.57%
jan 1, 2003
26.626
+1.038
4.06%
jan 1, 2004
8.089
-18.537
-69.62%
jan 1, 2005
9.192
+1.103
13.63%
jan 1, 2006
9.205
+0.013
0.14%
jan 1, 2007
10.681
+1.476
16.04%
jan 1, 2008
7.948
-2.733
-25.59%
jan 1, 2009
7.76
-0.188
-2.36%
jan 1, 2010
12.311
+4.552
58.66%
jan 1, 2011
9.353
-2.958
-24.03%
jan 1, 2012
11.649
+2.296
24.55%
jan 1, 2013
11.71
+0.061
0.53%
jan 1, 2014
11.797
+0.087
0.74%
jan 1, 2015
10.553
-1.244
-10.55%
Ranking of countries by current statistics by years


Comments: