29
/
en
AIzaSyAYiBZKx7MnpbEhh9jyipgxe19OcubqV5w
April 1, 2024
73227
Australia
AUS
true
2
1
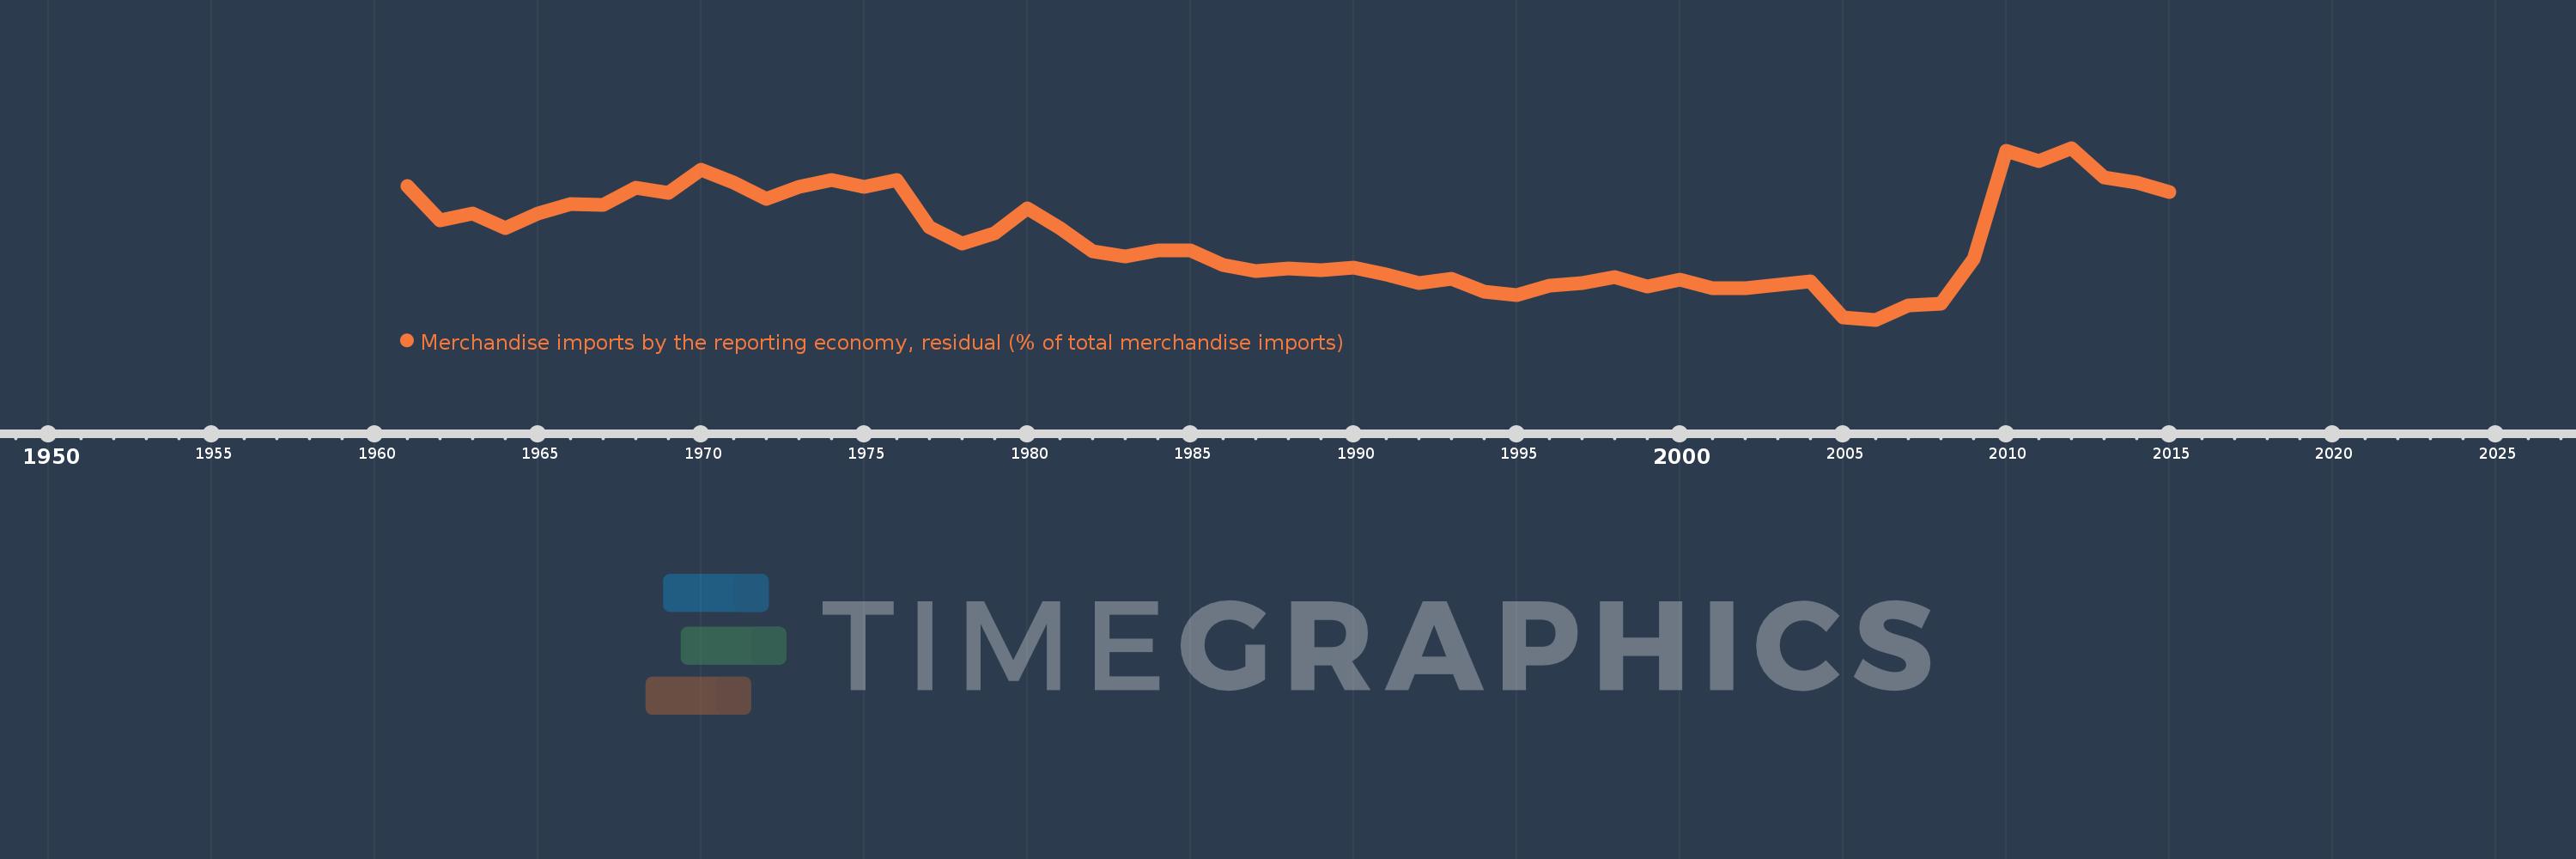
Merchandise imports by the reporting economy, residual (% of total merchandise imports)
2015,2014,2013,2012,2011,2010,2009,2008,2007,2006,2005,2004,2003,2002,2001,2000,1999,1998,1997,1996,1995,1994,1993,1992,1991,1990,1989,1988,1987,1986,1985,1984,1983,1982,1981,1980,1979,1978,1977,1976,1975,1974,1973,1972,1971,1970,1969,1968,1967,1966,1965,1964,1963,1962,1961
This statistics in other country:
AfghanistanAlbaniaAlgeriaAmerican SamoaAngolaAntigua and BarbudaArab WorldArgentinaArmeniaArubaAustraliaAustriaAzerbaijanBahamas, TheBahrainBangladeshBarbadosBelarusBelgiumBelizeBeninBermudaBoliviaBosnia and HerzegovinaBrazilBrunei DarussalamBulgariaBurkina FasoBurundiCabo VerdeCambodiaCameroonCanadaCaribbean small statesCentral African RepublicCentral Europe and the BalticsChadChileChinaColombiaComorosCongo, Dem. Rep.Congo, Rep.Costa RicaCote d'IvoireCroatiaCubaCyprusCzech RepublicDenmarkDjiboutiDominicaDominican RepublicEarly-demographic dividendEast Asia & PacificEast Asia & Pacific (excluding high income)East Asia & Pacific (IDA & IBRD countries)EcuadorEgypt, Arab Rep.El SalvadorEquatorial GuineaEstoniaEthiopiaEuro areaEurope & Central AsiaEurope & Central Asia (excluding high income)Europe & Central Asia (IDA & IBRD countries)European UnionFaroe IslandsFijiFinlandFragile and conflict affected situationsFranceFrench PolynesiaGabonGambia, TheGeorgiaGermanyGhanaGibraltarGreeceGreenlandGrenadaGuamGuatemalaGuineaGuinea-BissauGuyanaHaitiHeavily indebted poor countries (HIPC)High incomeHondurasHong Kong SAR, ChinaHungaryIBRD onlyIcelandIDA & IBRD totalIDA blendIDA onlyIDA totalIndiaIndonesiaIran, Islamic Rep.IraqIrelandIsraelItalyJamaicaJapanJordanKazakhstanKenyaKiribatiKorea, Dem. People’s Rep.Korea, Rep.KosovoKuwaitKyrgyz RepublicLao PDRLate-demographic dividendLatin America & Caribbean Latin America & Caribbean (excluding high income)Latin America & the Caribbean (IDA & IBRD countries)LatviaLeast developed countries: UN classificationLebanonLiberiaLibyaLithuaniaLow & middle incomeLow incomeLower middle incomeLuxembourgMacao SAR, ChinaMacedonia, FYRMadagascarMalawiMalaysiaMaldivesMaliMaltaMauritaniaMauritiusMexicoMiddle East & North AfricaMiddle East & North Africa (excluding high income)Middle East & North Africa (IDA & IBRD countries)Middle incomeMoldovaMongoliaMontenegroMoroccoMozambiqueMyanmarNauruNepalNetherlandsNew CaledoniaNew ZealandNicaraguaNigerNigeriaNorth AmericaNorwayOECD membersOmanOther small statesPacific island small statesPakistanPanamaPapua New GuineaParaguayPeruPhilippinesPolandPortugalPost-demographic dividendPre-demographic dividendQatarRomaniaRussian FederationRwandaSamoaSao Tome and PrincipeSaudi ArabiaSenegalSerbiaSeychellesSierra LeoneSingaporeSlovak RepublicSloveniaSmall statesSolomon IslandsSomaliaSouth AfricaSouth AsiaSouth Asia (IDA & IBRD)SpainSri LankaSt. Kitts and NevisSt. LuciaSt. Vincent and the GrenadinesSub-Saharan Africa Sub-Saharan Africa (excluding high income)Sub-Saharan Africa (IDA & IBRD countries)SudanSurinameSwedenSwitzerlandSyrian Arab RepublicTajikistanTanzaniaThailandTogoTongaTrinidad and TobagoTunisiaTurkeyTurkmenistanTuvaluUgandaUkraineUnited Arab EmiratesUnited KingdomUnited StatesUpper middle incomeUruguayUzbekistanVanuatuVenezuela, RBVietnamWorldYemen, Rep.ZambiaZimbabwe Timeline:
This timeline shows a graph from 1961 to 2015 of Australia. No data until 1960. Number of actual observations by date: 55.
Source name:
World Development Indicators
Source organization:
World Bank staff estimates based data from International Monetary Fund's Direction of Trade database.
Categories, topics:
Private Sector, Trade
Last updated:
apr 23, 2017
Indicators value changes by year
At the date of observation
Value
Absolute change
Change from previous value
jan 1, 1961
3.29
+3.29
0.0%
jan 1, 1962
2.568
-0.723
-21.96%
jan 1, 1963
2.707
+0.139
5.41%
jan 1, 1964
2.396
-0.311
-11.49%
jan 1, 1965
2.714
+0.318
13.28%
jan 1, 1966
2.918
+0.204
7.52%
jan 1, 1967
2.897
-0.021
-0.71%
jan 1, 1968
3.25
+0.353
12.17%
jan 1, 1969
3.147
-0.103
-3.16%
jan 1, 1970
3.63
+0.483
15.34%
jan 1, 1971
3.373
-0.258
-7.1%
jan 1, 1972
3.02
-0.352
-10.45%
jan 1, 1973
3.276
+0.256
8.47%
jan 1, 1974
3.42
+0.144
4.4%
jan 1, 1975
3.274
-0.146
-4.26%
jan 1, 1976
3.413
+0.138
4.22%
jan 1, 1977
2.424
-0.989
-28.98%
jan 1, 1978
2.082
-0.341
-14.08%
jan 1, 1979
2.304
+0.222
10.65%
jan 1, 1980
2.83
+0.525
22.8%
jan 1, 1981
2.413
-0.417
-14.74%
jan 1, 1982
1.922
-0.491
-20.34%
jan 1, 1983
1.798
-0.124
-6.47%
jan 1, 1984
1.935
+0.138
7.65%
jan 1, 1985
1.939
+0.004
0.19%
jan 1, 1986
1.617
-0.322
-16.61%
jan 1, 1987
1.492
-0.125
-7.74%
jan 1, 1988
1.545
+0.053
3.53%
jan 1, 1989
1.523
-0.022
-1.4%
jan 1, 1990
1.578
+0.055
3.62%
jan 1, 1991
1.42
-0.159
-10.05%
jan 1, 1992
1.24
-0.18
-12.67%
jan 1, 1993
1.329
+0.089
7.2%
jan 1, 1994
1.07
-0.26
-19.53%
jan 1, 1995
0.986
-0.083
-7.77%
jan 1, 1996
1.185
+0.198
20.12%
jan 1, 1997
1.245
+0.06
5.06%
jan 1, 1998
1.376
+0.131
10.53%
jan 1, 1999
1.176
-0.2
-14.51%
jan 1, 2000
1.324
+0.148
12.56%
jan 1, 2001
1.134
-0.19
-14.32%
jan 1, 2002
1.136
+0.002
0.19%
jan 1, 2003
1.216
+0.079
6.97%
jan 1, 2004
1.281
+0.066
5.42%
jan 1, 2005
0.514
-0.767
-59.88%
jan 1, 2006
0.469
-0.045
-8.79%
jan 1, 2007
0.774
+0.305
65.04%
jan 1, 2008
0.815
+0.041
5.24%
jan 1, 2009
1.745
+0.931
114.26%
jan 1, 2010
4.045
+2.299
131.76%
jan 1, 2011
3.828
-0.217
-5.36%
jan 1, 2012
4.098
+0.27
7.05%
jan 1, 2013
3.48
-0.618
-15.08%
jan 1, 2014
3.373
-0.107
-3.09%
jan 1, 2015
3.173
-0.2
-5.92%
Ranking of countries by current statistics by years


Comments: