29
/
en
AIzaSyAYiBZKx7MnpbEhh9jyipgxe19OcubqV5w
April 1, 2024
261190
Tanzania
TZA
true
2
1
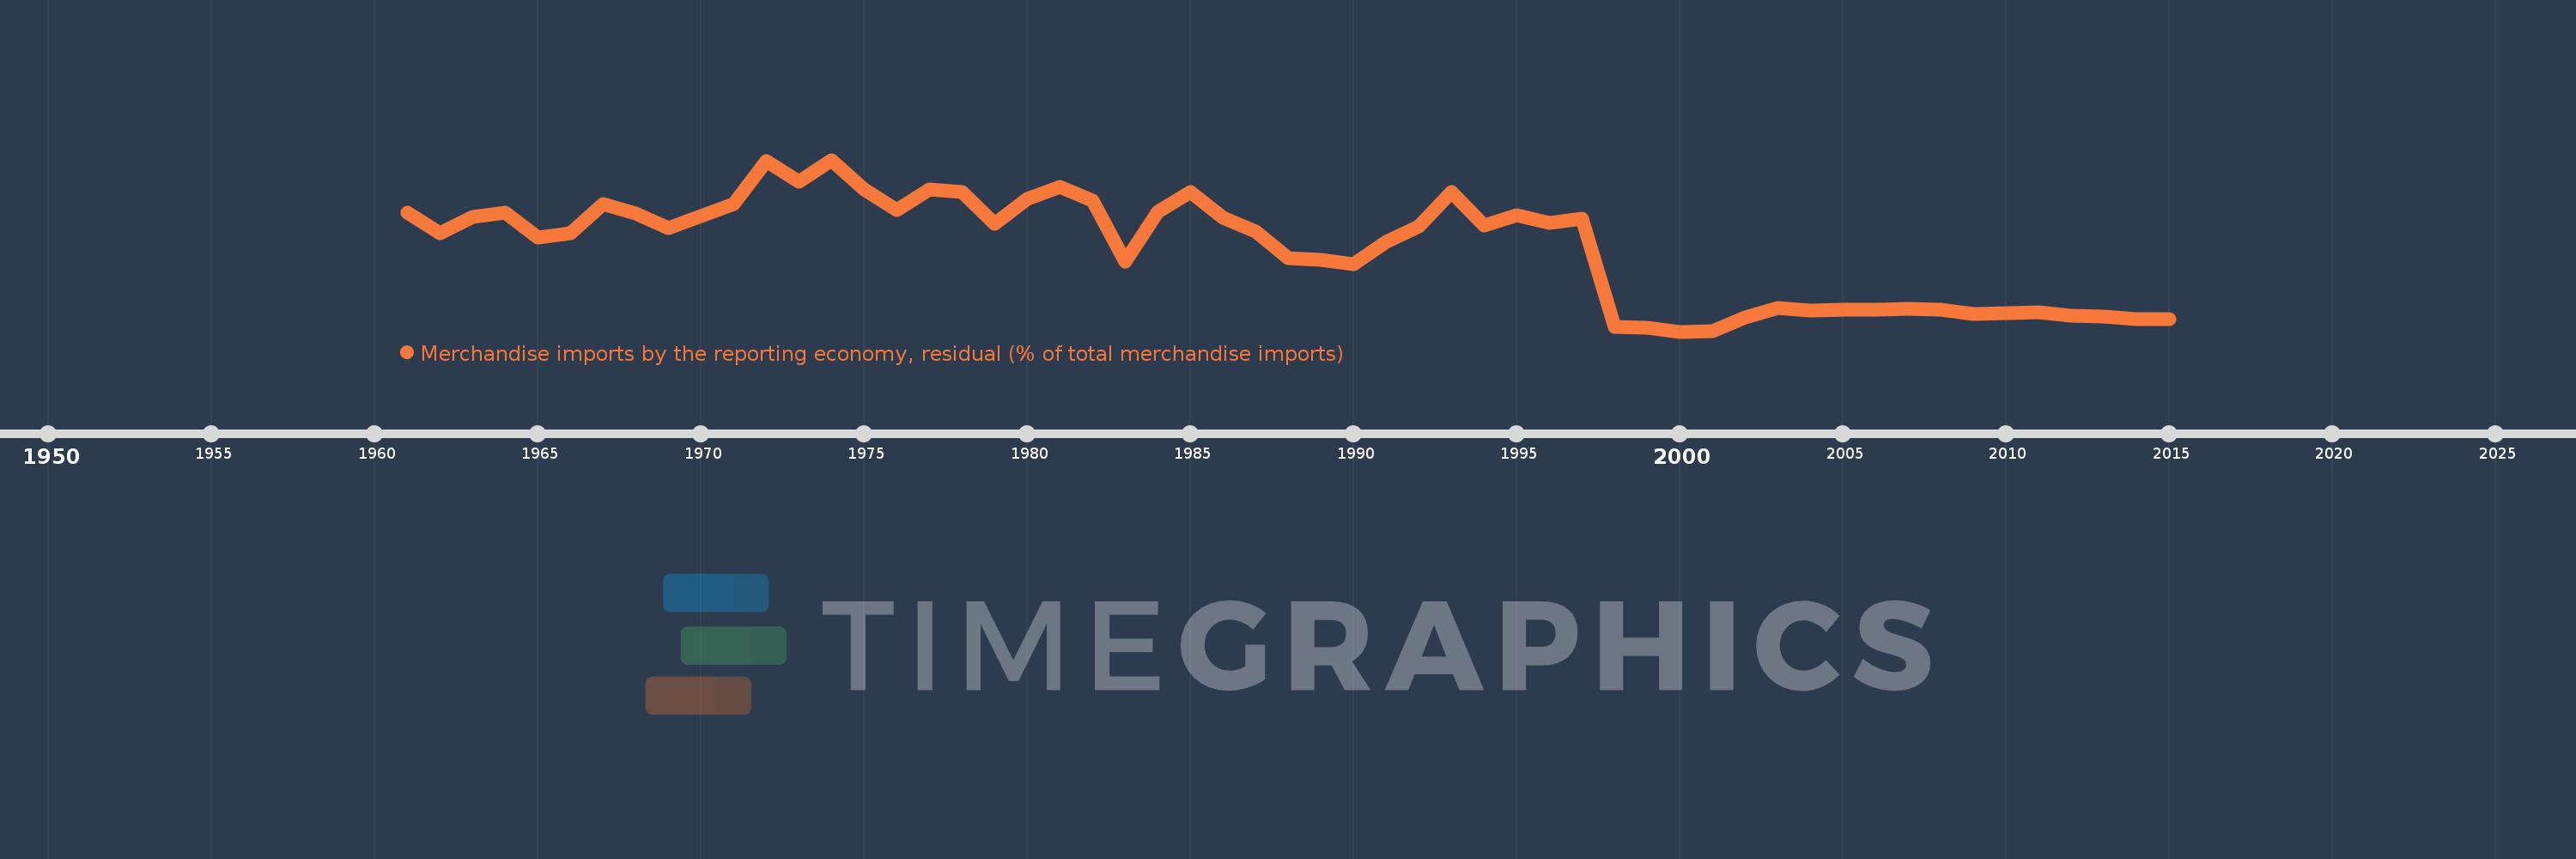
Merchandise imports by the reporting economy, residual (% of total merchandise imports)
2015,2014,2013,2012,2011,2010,2009,2008,2007,2006,2005,2004,2003,2002,2001,2000,1999,1998,1997,1996,1995,1994,1993,1992,1991,1990,1989,1988,1987,1986,1985,1984,1983,1982,1981,1980,1979,1978,1977,1976,1975,1974,1973,1972,1971,1970,1969,1968,1967,1966,1965,1964,1963,1962,1961
This statistics in other country:
AfghanistanAlbaniaAlgeriaAmerican SamoaAngolaAntigua and BarbudaArab WorldArgentinaArmeniaArubaAustraliaAustriaAzerbaijanBahamas, TheBahrainBangladeshBarbadosBelarusBelgiumBelizeBeninBermudaBoliviaBosnia and HerzegovinaBrazilBrunei DarussalamBulgariaBurkina FasoBurundiCabo VerdeCambodiaCameroonCanadaCaribbean small statesCentral African RepublicCentral Europe and the BalticsChadChileChinaColombiaComorosCongo, Dem. Rep.Congo, Rep.Costa RicaCote d'IvoireCroatiaCubaCyprusCzech RepublicDenmarkDjiboutiDominicaDominican RepublicEarly-demographic dividendEast Asia & PacificEast Asia & Pacific (excluding high income)East Asia & Pacific (IDA & IBRD countries)EcuadorEgypt, Arab Rep.El SalvadorEquatorial GuineaEstoniaEthiopiaEuro areaEurope & Central AsiaEurope & Central Asia (excluding high income)Europe & Central Asia (IDA & IBRD countries)European UnionFaroe IslandsFijiFinlandFragile and conflict affected situationsFranceFrench PolynesiaGabonGambia, TheGeorgiaGermanyGhanaGibraltarGreeceGreenlandGrenadaGuamGuatemalaGuineaGuinea-BissauGuyanaHaitiHeavily indebted poor countries (HIPC)High incomeHondurasHong Kong SAR, ChinaHungaryIBRD onlyIcelandIDA & IBRD totalIDA blendIDA onlyIDA totalIndiaIndonesiaIran, Islamic Rep.IraqIrelandIsraelItalyJamaicaJapanJordanKazakhstanKenyaKiribatiKorea, Dem. People’s Rep.Korea, Rep.KosovoKuwaitKyrgyz RepublicLao PDRLate-demographic dividendLatin America & Caribbean Latin America & Caribbean (excluding high income)Latin America & the Caribbean (IDA & IBRD countries)LatviaLeast developed countries: UN classificationLebanonLiberiaLibyaLithuaniaLow & middle incomeLow incomeLower middle incomeLuxembourgMacao SAR, ChinaMacedonia, FYRMadagascarMalawiMalaysiaMaldivesMaliMaltaMauritaniaMauritiusMexicoMiddle East & North AfricaMiddle East & North Africa (excluding high income)Middle East & North Africa (IDA & IBRD countries)Middle incomeMoldovaMongoliaMontenegroMoroccoMozambiqueMyanmarNauruNepalNetherlandsNew CaledoniaNew ZealandNicaraguaNigerNigeriaNorth AmericaNorwayOECD membersOmanOther small statesPacific island small statesPakistanPanamaPapua New GuineaParaguayPeruPhilippinesPolandPortugalPost-demographic dividendPre-demographic dividendQatarRomaniaRussian FederationRwandaSamoaSao Tome and PrincipeSaudi ArabiaSenegalSerbiaSeychellesSierra LeoneSingaporeSlovak RepublicSloveniaSmall statesSolomon IslandsSomaliaSouth AfricaSouth AsiaSouth Asia (IDA & IBRD)SpainSri LankaSt. Kitts and NevisSt. LuciaSt. Vincent and the GrenadinesSub-Saharan Africa Sub-Saharan Africa (excluding high income)Sub-Saharan Africa (IDA & IBRD countries)SudanSurinameSwedenSwitzerlandSyrian Arab RepublicTajikistanTanzaniaThailandTogoTongaTrinidad and TobagoTunisiaTurkeyTurkmenistanTuvaluUgandaUkraineUnited Arab EmiratesUnited KingdomUnited StatesUpper middle incomeUruguayUzbekistanVanuatuVenezuela, RBVietnamWorldYemen, Rep.ZambiaZimbabwe Timeline:
This timeline shows a graph from 1961 to 2015 of Tanzania. No data until 1960. Number of actual observations by date: 55.
Source name:
World Development Indicators
Source organization:
World Bank staff estimates based data from International Monetary Fund's Direction of Trade database.
Categories, topics:
Private Sector, Trade
Last updated:
apr 23, 2017
Indicators value changes by year
Maximum:
33.165
jan 1, 1974
At the date of observation
Value
Absolute change
Change from previous value
jan 1, 1961
22.975
+22.975
0.0%
jan 1, 1962
19.026
-3.949
-17.19%
jan 1, 1963
22.143
+3.117
16.39%
jan 1, 1964
22.959
+0.816
3.68%
jan 1, 1965
18.234
-4.725
-20.58%
jan 1, 1966
19.082
+0.848
4.65%
jan 1, 1967
24.597
+5.515
28.9%
jan 1, 1968
22.759
-1.837
-7.47%
jan 1, 1969
20.089
-2.67
-11.73%
jan 1, 1970
22.31
+2.221
11.05%
jan 1, 1971
24.623
+2.313
10.37%
jan 1, 1972
32.934
+8.311
33.76%
jan 1, 1973
28.92
-4.014
-12.19%
jan 1, 1974
33.165
+4.245
14.68%
jan 1, 1975
27.462
-5.704
-17.2%
jan 1, 1976
23.472
-3.989
-14.53%
jan 1, 1977
27.394
+3.921
16.71%
jan 1, 1978
26.923
-0.471
-1.72%
jan 1, 1979
20.847
-6.076
-22.57%
jan 1, 1980
25.591
+4.744
22.76%
jan 1, 1981
27.883
+2.292
8.96%
jan 1, 1982
25.377
-2.507
-8.99%
jan 1, 1983
13.586
-11.791
-46.46%
jan 1, 1984
23.139
+9.553
70.32%
jan 1, 1985
26.903
+3.764
16.27%
jan 1, 1986
21.947
-4.956
-18.42%
jan 1, 1987
19.286
-2.661
-12.13%
jan 1, 1988
14.23
-5.055
-26.21%
jan 1, 1989
13.824
-0.407
-2.86%
jan 1, 1990
13.084
-0.74
-5.35%
jan 1, 1991
17.309
+4.225
32.29%
jan 1, 1992
20.31
+3.001
17.34%
jan 1, 1993
26.888
+6.577
32.38%
jan 1, 1994
20.472
-6.416
-23.86%
jan 1, 1995
22.569
+2.097
10.25%
jan 1, 1996
21.07
-1.499
-6.64%
jan 1, 1997
21.91
+0.84
3.98%
jan 1, 1998
0.976
-20.934
-95.55%
jan 1, 1999
0.905
-0.071
-7.23%
jan 1, 2000
0.083
-0.822
-90.84%
jan 1, 2001
0.174
+0.091
109.38%
jan 1, 2002
2.862
+2.688
1.55K%
jan 1, 2003
4.606
+1.744
60.94%
jan 1, 2004
4.129
-0.477
-10.35%
jan 1, 2005
4.376
+0.247
5.98%
jan 1, 2006
4.295
-0.08
-1.84%
jan 1, 2007
4.523
+0.228
5.31%
jan 1, 2008
4.219
-0.304
-6.73%
jan 1, 2009
3.485
-0.734
-17.39%
jan 1, 2010
3.597
+0.112
3.21%
jan 1, 2011
3.723
+0.126
3.5%
jan 1, 2012
3.09
-0.633
-17.0%
jan 1, 2013
3.041
-0.049
-1.59%
jan 1, 2014
2.553
-0.488
-16.05%
jan 1, 2015
2.476
-0.077
-3.0%
Ranking of countries by current statistics by years


Comments: