29
/
en
AIzaSyAYiBZKx7MnpbEhh9jyipgxe19OcubqV5w
April 1, 2024
185468
Madagascar
MDG
true
2
1
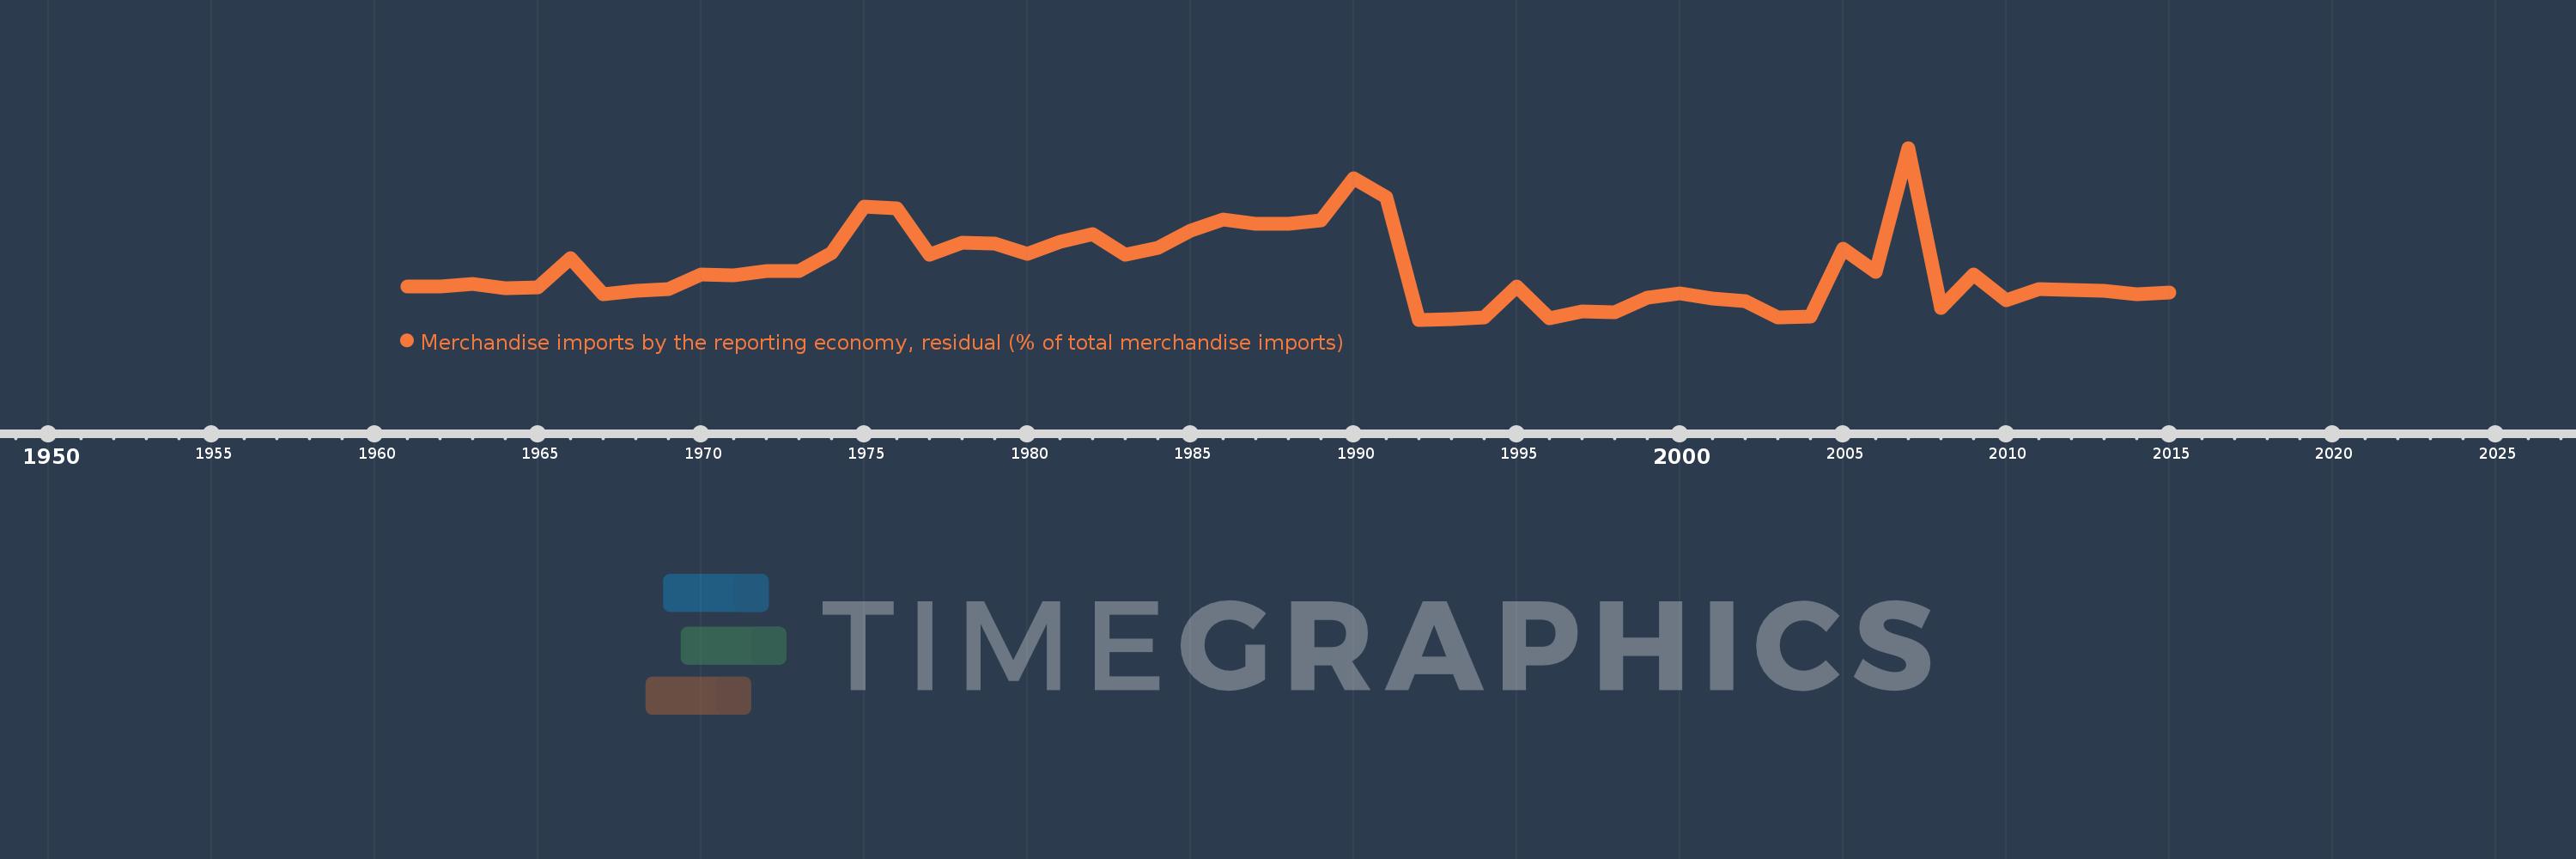
Merchandise imports by the reporting economy, residual (% of total merchandise imports)
2015,2014,2013,2012,2011,2010,2009,2008,2007,2006,2005,2004,2003,2002,2001,2000,1999,1998,1997,1996,1995,1994,1993,1992,1991,1990,1989,1988,1987,1986,1985,1984,1983,1982,1981,1980,1979,1978,1977,1976,1975,1974,1973,1972,1971,1970,1969,1968,1967,1966,1965,1964,1963,1962,1961
This statistics in other country:
AfghanistanAlbaniaAlgeriaAmerican SamoaAngolaAntigua and BarbudaArab WorldArgentinaArmeniaArubaAustraliaAustriaAzerbaijanBahamas, TheBahrainBangladeshBarbadosBelarusBelgiumBelizeBeninBermudaBoliviaBosnia and HerzegovinaBrazilBrunei DarussalamBulgariaBurkina FasoBurundiCabo VerdeCambodiaCameroonCanadaCaribbean small statesCentral African RepublicCentral Europe and the BalticsChadChileChinaColombiaComorosCongo, Dem. Rep.Congo, Rep.Costa RicaCote d'IvoireCroatiaCubaCyprusCzech RepublicDenmarkDjiboutiDominicaDominican RepublicEarly-demographic dividendEast Asia & PacificEast Asia & Pacific (excluding high income)East Asia & Pacific (IDA & IBRD countries)EcuadorEgypt, Arab Rep.El SalvadorEquatorial GuineaEstoniaEthiopiaEuro areaEurope & Central AsiaEurope & Central Asia (excluding high income)Europe & Central Asia (IDA & IBRD countries)European UnionFaroe IslandsFijiFinlandFragile and conflict affected situationsFranceFrench PolynesiaGabonGambia, TheGeorgiaGermanyGhanaGibraltarGreeceGreenlandGrenadaGuamGuatemalaGuineaGuinea-BissauGuyanaHaitiHeavily indebted poor countries (HIPC)High incomeHondurasHong Kong SAR, ChinaHungaryIBRD onlyIcelandIDA & IBRD totalIDA blendIDA onlyIDA totalIndiaIndonesiaIran, Islamic Rep.IraqIrelandIsraelItalyJamaicaJapanJordanKazakhstanKenyaKiribatiKorea, Dem. People’s Rep.Korea, Rep.KosovoKuwaitKyrgyz RepublicLao PDRLate-demographic dividendLatin America & Caribbean Latin America & Caribbean (excluding high income)Latin America & the Caribbean (IDA & IBRD countries)LatviaLeast developed countries: UN classificationLebanonLiberiaLibyaLithuaniaLow & middle incomeLow incomeLower middle incomeLuxembourgMacao SAR, ChinaMacedonia, FYRMadagascarMalawiMalaysiaMaldivesMaliMaltaMauritaniaMauritiusMexicoMiddle East & North AfricaMiddle East & North Africa (excluding high income)Middle East & North Africa (IDA & IBRD countries)Middle incomeMoldovaMongoliaMontenegroMoroccoMozambiqueMyanmarNauruNepalNetherlandsNew CaledoniaNew ZealandNicaraguaNigerNigeriaNorth AmericaNorwayOECD membersOmanOther small statesPacific island small statesPakistanPanamaPapua New GuineaParaguayPeruPhilippinesPolandPortugalPost-demographic dividendPre-demographic dividendQatarRomaniaRussian FederationRwandaSamoaSao Tome and PrincipeSaudi ArabiaSenegalSerbiaSeychellesSierra LeoneSingaporeSlovak RepublicSloveniaSmall statesSolomon IslandsSomaliaSouth AfricaSouth AsiaSouth Asia (IDA & IBRD)SpainSri LankaSt. Kitts and NevisSt. LuciaSt. Vincent and the GrenadinesSub-Saharan Africa Sub-Saharan Africa (excluding high income)Sub-Saharan Africa (IDA & IBRD countries)SudanSurinameSwedenSwitzerlandSyrian Arab RepublicTajikistanTanzaniaThailandTogoTongaTrinidad and TobagoTunisiaTurkeyTurkmenistanTuvaluUgandaUkraineUnited Arab EmiratesUnited KingdomUnited StatesUpper middle incomeUruguayUzbekistanVanuatuVenezuela, RBVietnamWorldYemen, Rep.ZambiaZimbabwe Timeline:
This timeline shows a graph from 1961 to 2015 of Madagascar. No data until 1960. Number of actual observations by date: 55.
Source name:
World Development Indicators
Source organization:
World Bank staff estimates based data from International Monetary Fund's Direction of Trade database.
Categories, topics:
Private Sector, Trade
Last updated:
apr 23, 2017
Indicators value changes by year
At the date of observation
Value
Absolute change
Change from previous value
jan 1, 1961
11.722
+11.722
0.0%
jan 1, 1962
11.822
+0.099
0.85%
jan 1, 1963
12.418
+0.596
5.04%
jan 1, 1964
11.294
-1.124
-9.05%
jan 1, 1965
11.538
+0.244
2.16%
jan 1, 1966
19.781
+8.243
71.44%
jan 1, 1967
9.51
-10.271
-51.92%
jan 1, 1968
10.537
+1.027
10.8%
jan 1, 1969
11.085
+0.548
5.2%
jan 1, 1970
15.313
+4.228
38.14%
jan 1, 1971
14.869
-0.444
-2.9%
jan 1, 1972
16.234
+1.365
9.18%
jan 1, 1973
16.299
+0.064
0.4%
jan 1, 1974
21.341
+5.043
30.94%
jan 1, 1975
34.69
+13.349
62.55%
jan 1, 1976
34.064
-0.626
-1.8%
jan 1, 1977
20.772
-13.293
-39.02%
jan 1, 1978
24.387
+3.615
17.4%
jan 1, 1979
24.091
-0.296
-1.21%
jan 1, 1980
21.071
-3.019
-12.53%
jan 1, 1981
24.428
+3.357
15.93%
jan 1, 1982
26.76
+2.332
9.55%
jan 1, 1983
20.955
-5.806
-21.69%
jan 1, 1984
22.868
+1.913
9.13%
jan 1, 1985
27.651
+4.783
20.92%
jan 1, 1986
30.987
+3.336
12.06%
jan 1, 1987
29.825
-1.162
-3.75%
jan 1, 1988
29.595
-0.231
-0.77%
jan 1, 1989
30.597
+1.002
3.39%
jan 1, 1990
42.724
+12.127
39.63%
jan 1, 1991
37.277
-5.446
-12.75%
jan 1, 1992
2.249
-35.028
-93.97%
jan 1, 1993
2.33
+0.081
3.58%
jan 1, 1994
2.899
+0.569
24.42%
jan 1, 1995
11.769
+8.87
306.02%
jan 1, 1996
2.755
-9.013
-76.59%
jan 1, 1997
4.705
+1.95
70.76%
jan 1, 1998
4.501
-0.204
-4.33%
jan 1, 1999
8.502
+4.001
88.88%
jan 1, 2000
9.687
+1.184
13.93%
jan 1, 2001
8.214
-1.473
-15.2%
jan 1, 2002
7.576
-0.638
-7.77%
jan 1, 2003
2.913
-4.663
-61.55%
jan 1, 2004
3.079
+0.166
5.71%
jan 1, 2005
22.651
+19.572
635.56%
jan 1, 2006
15.902
-6.75
-29.8%
jan 1, 2007
51.42
+35.519
223.37%
jan 1, 2008
5.662
-45.758
-88.99%
jan 1, 2009
15.188
+9.526
168.24%
jan 1, 2010
7.86
-7.329
-48.25%
jan 1, 2011
11.095
+3.235
41.16%
jan 1, 2012
10.819
-0.276
-2.49%
jan 1, 2013
10.511
-0.308
-2.84%
jan 1, 2014
9.567
-0.944
-8.98%
jan 1, 2015
9.931
+0.364
3.8%
Ranking of countries by current statistics by years


Comments: