29
/
en
AIzaSyAYiBZKx7MnpbEhh9jyipgxe19OcubqV5w
April 1, 2024
216720
Pakistan
PAK
true
2
1
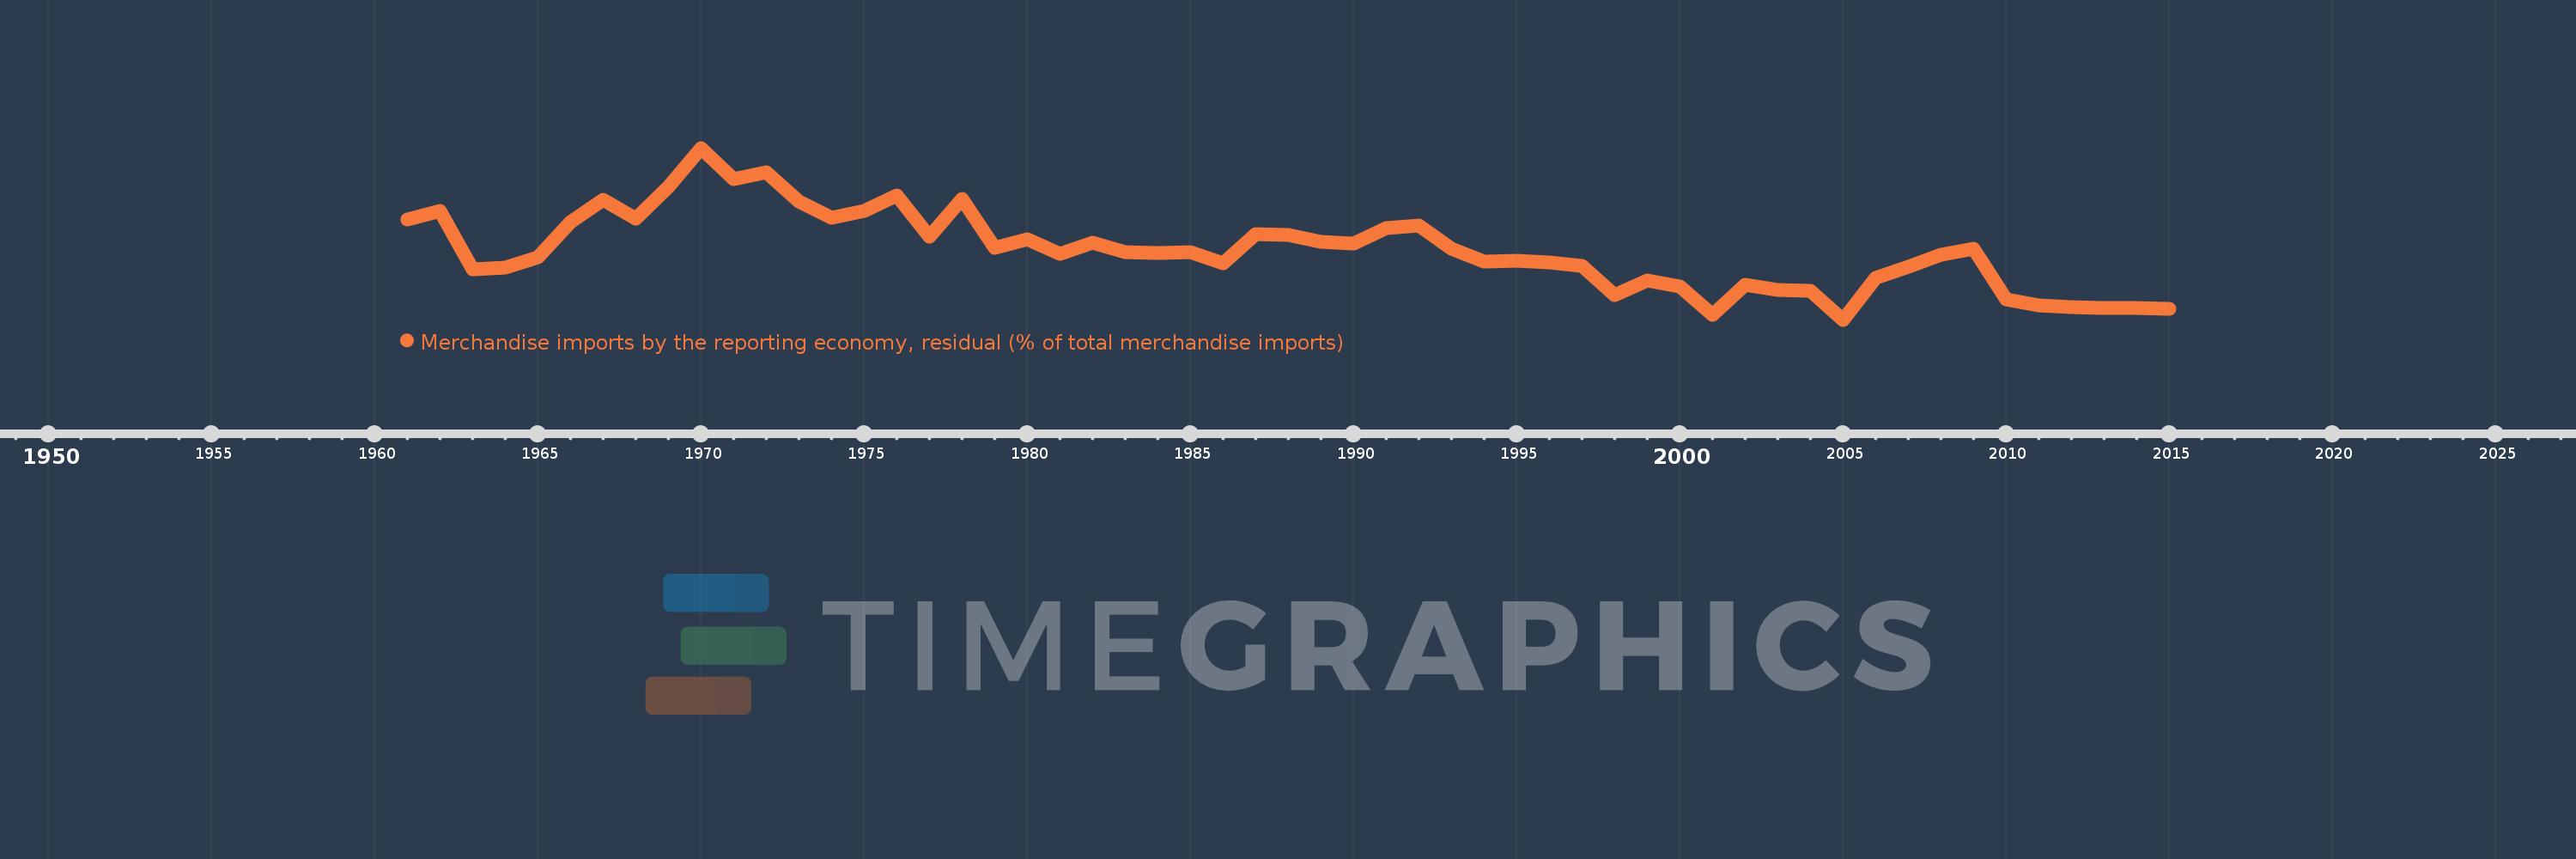
Merchandise imports by the reporting economy, residual (% of total merchandise imports)
2015,2014,2013,2012,2011,2010,2009,2008,2007,2006,2005,2004,2003,2002,2001,2000,1999,1998,1997,1996,1995,1994,1993,1992,1991,1990,1989,1988,1987,1986,1985,1984,1983,1982,1981,1980,1979,1978,1977,1976,1975,1974,1973,1972,1971,1970,1969,1968,1967,1966,1965,1964,1963,1962,1961
This statistics in other country:
AfghanistanAlbaniaAlgeriaAmerican SamoaAngolaAntigua and BarbudaArab WorldArgentinaArmeniaArubaAustraliaAustriaAzerbaijanBahamas, TheBahrainBangladeshBarbadosBelarusBelgiumBelizeBeninBermudaBoliviaBosnia and HerzegovinaBrazilBrunei DarussalamBulgariaBurkina FasoBurundiCabo VerdeCambodiaCameroonCanadaCaribbean small statesCentral African RepublicCentral Europe and the BalticsChadChileChinaColombiaComorosCongo, Dem. Rep.Congo, Rep.Costa RicaCote d'IvoireCroatiaCubaCyprusCzech RepublicDenmarkDjiboutiDominicaDominican RepublicEarly-demographic dividendEast Asia & PacificEast Asia & Pacific (excluding high income)East Asia & Pacific (IDA & IBRD countries)EcuadorEgypt, Arab Rep.El SalvadorEquatorial GuineaEstoniaEthiopiaEuro areaEurope & Central AsiaEurope & Central Asia (excluding high income)Europe & Central Asia (IDA & IBRD countries)European UnionFaroe IslandsFijiFinlandFragile and conflict affected situationsFranceFrench PolynesiaGabonGambia, TheGeorgiaGermanyGhanaGibraltarGreeceGreenlandGrenadaGuamGuatemalaGuineaGuinea-BissauGuyanaHaitiHeavily indebted poor countries (HIPC)High incomeHondurasHong Kong SAR, ChinaHungaryIBRD onlyIcelandIDA & IBRD totalIDA blendIDA onlyIDA totalIndiaIndonesiaIran, Islamic Rep.IraqIrelandIsraelItalyJamaicaJapanJordanKazakhstanKenyaKiribatiKorea, Dem. People’s Rep.Korea, Rep.KosovoKuwaitKyrgyz RepublicLao PDRLate-demographic dividendLatin America & Caribbean Latin America & Caribbean (excluding high income)Latin America & the Caribbean (IDA & IBRD countries)LatviaLeast developed countries: UN classificationLebanonLiberiaLibyaLithuaniaLow & middle incomeLow incomeLower middle incomeLuxembourgMacao SAR, ChinaMacedonia, FYRMadagascarMalawiMalaysiaMaldivesMaliMaltaMauritaniaMauritiusMexicoMiddle East & North AfricaMiddle East & North Africa (excluding high income)Middle East & North Africa (IDA & IBRD countries)Middle incomeMoldovaMongoliaMontenegroMoroccoMozambiqueMyanmarNauruNepalNetherlandsNew CaledoniaNew ZealandNicaraguaNigerNigeriaNorth AmericaNorwayOECD membersOmanOther small statesPacific island small statesPakistanPanamaPapua New GuineaParaguayPeruPhilippinesPolandPortugalPost-demographic dividendPre-demographic dividendQatarRomaniaRussian FederationRwandaSamoaSao Tome and PrincipeSaudi ArabiaSenegalSerbiaSeychellesSierra LeoneSingaporeSlovak RepublicSloveniaSmall statesSolomon IslandsSomaliaSouth AfricaSouth AsiaSouth Asia (IDA & IBRD)SpainSri LankaSt. Kitts and NevisSt. LuciaSt. Vincent and the GrenadinesSub-Saharan Africa Sub-Saharan Africa (excluding high income)Sub-Saharan Africa (IDA & IBRD countries)SudanSurinameSwedenSwitzerlandSyrian Arab RepublicTajikistanTanzaniaThailandTogoTongaTrinidad and TobagoTunisiaTurkeyTurkmenistanTuvaluUgandaUkraineUnited Arab EmiratesUnited KingdomUnited StatesUpper middle incomeUruguayUzbekistanVanuatuVenezuela, RBVietnamWorldYemen, Rep.ZambiaZimbabwe Timeline:
This timeline shows a graph from 1961 to 2015 of Pakistan. No data until 1960. Number of actual observations by date: 55.
Source name:
World Development Indicators
Source organization:
World Bank staff estimates based data from International Monetary Fund's Direction of Trade database.
Categories, topics:
Private Sector, Trade
Last updated:
apr 23, 2017
Indicators value changes by year
At the date of observation
Value
Absolute change
Change from previous value
jan 1, 1961
4.754
+4.754
0.0%
jan 1, 1962
5.159
+0.406
8.53%
jan 1, 1963
2.404
-2.756
-53.41%
jan 1, 1964
2.476
+0.073
3.02%
jan 1, 1965
2.958
+0.482
19.46%
jan 1, 1966
4.647
+1.689
57.12%
jan 1, 1967
5.694
+1.047
22.52%
jan 1, 1968
4.781
-0.913
-16.03%
jan 1, 1969
6.276
+1.494
31.25%
jan 1, 1970
8.124
+1.848
29.45%
jan 1, 1971
6.645
-1.479
-18.21%
jan 1, 1972
6.982
+0.337
5.07%
jan 1, 1973
5.594
-1.388
-19.88%
jan 1, 1974
4.837
-0.757
-13.54%
jan 1, 1975
5.159
+0.323
6.67%
jan 1, 1976
5.897
+0.738
14.3%
jan 1, 1977
3.962
-1.936
-32.82%
jan 1, 1978
5.723
+1.761
44.46%
jan 1, 1979
3.406
-2.317
-40.49%
jan 1, 1980
3.809
+0.403
11.84%
jan 1, 1981
3.123
-0.686
-18.0%
jan 1, 1982
3.653
+0.53
16.96%
jan 1, 1983
3.223
-0.43
-11.76%
jan 1, 1984
3.187
-0.037
-1.13%
jan 1, 1985
3.234
+0.047
1.49%
jan 1, 1986
2.693
-0.541
-16.73%
jan 1, 1987
4.061
+1.368
50.78%
jan 1, 1988
4.035
-0.025
-0.62%
jan 1, 1989
3.719
-0.316
-7.83%
jan 1, 1990
3.621
-0.098
-2.64%
jan 1, 1991
4.366
+0.745
20.58%
jan 1, 1992
4.475
+0.109
2.5%
jan 1, 1993
3.36
-1.115
-24.92%
jan 1, 1994
2.77
-0.59
-17.56%
jan 1, 1995
2.795
+0.025
0.91%
jan 1, 1996
2.736
-0.059
-2.12%
jan 1, 1997
2.586
-0.149
-5.46%
jan 1, 1998
1.187
-1.399
-54.09%
jan 1, 1999
1.875
+0.687
57.88%
jan 1, 2000
1.617
-0.258
-13.77%
jan 1, 2001
0.244
-1.372
-84.89%
jan 1, 2002
1.688
+1.444
591.02%
jan 1, 2003
1.456
-0.232
-13.74%
jan 1, 2004
1.397
-0.059
-4.08%
jan 1, 2005
0.033
-1.364
-97.67%
jan 1, 2006
2.023
+1.991
6.12K%
jan 1, 2007
2.528
+0.505
24.94%
jan 1, 2008
3.078
+0.55
21.75%
jan 1, 2009
3.391
+0.313
10.18%
jan 1, 2010
0.975
-2.416
-71.25%
jan 1, 2011
0.713
-0.261
-26.82%
jan 1, 2012
0.612
-0.101
-14.16%
jan 1, 2013
0.599
-0.013
-2.11%
jan 1, 2014
0.575
-0.024
-4.07%
jan 1, 2015
0.529
-0.046
-7.97%
Ranking of countries by current statistics by years


Comments: