29
/
en
AIzaSyAYiBZKx7MnpbEhh9jyipgxe19OcubqV5w
April 1, 2024
31824
Europe & Central Asia (excluding high income)
ECA
false
2
1
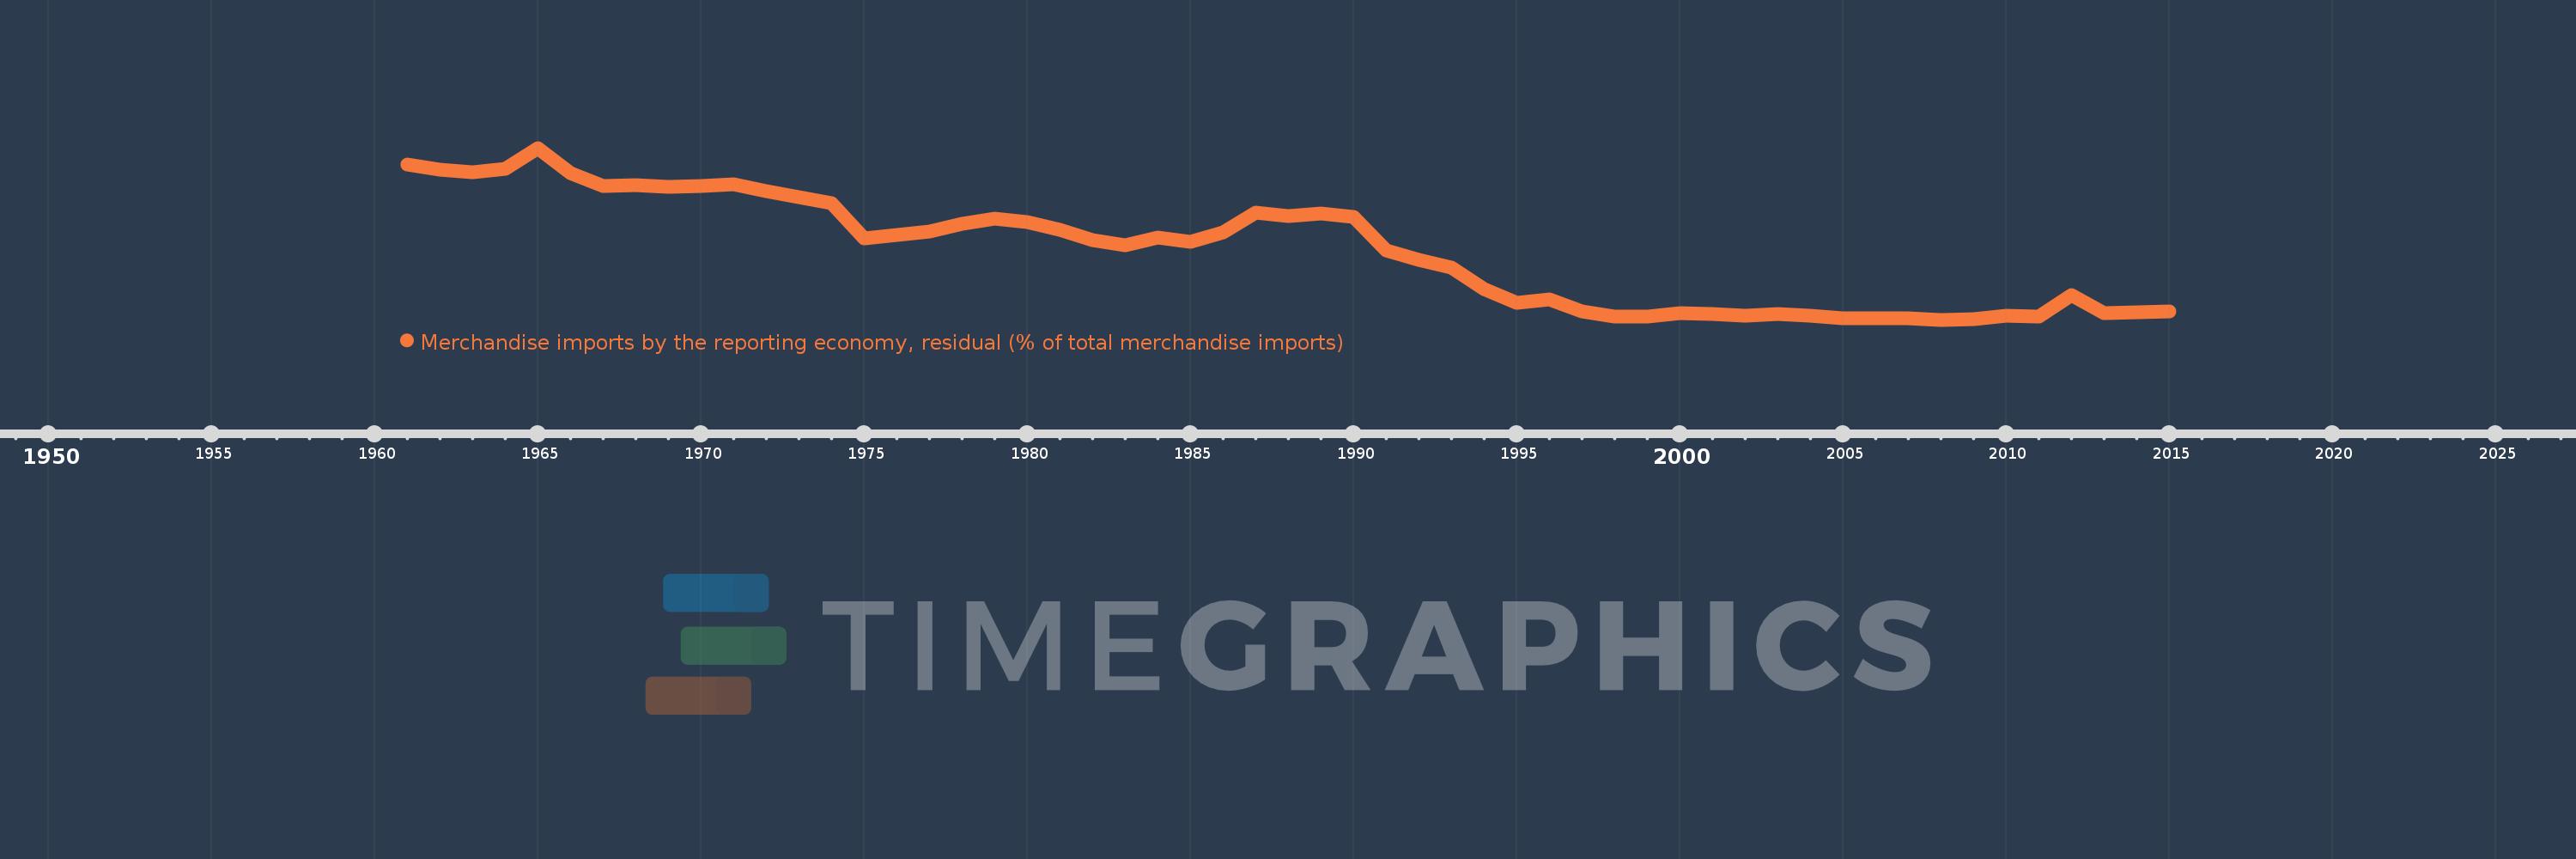
Merchandise imports by the reporting economy, residual (% of total merchandise imports)
2015,2014,2013,2012,2011,2010,2009,2008,2007,2006,2005,2004,2003,2002,2001,2000,1999,1998,1997,1996,1995,1994,1993,1992,1991,1990,1989,1988,1987,1986,1985,1984,1983,1982,1981,1980,1979,1978,1977,1976,1975,1974,1973,1972,1971,1970,1969,1968,1967,1966,1965,1964,1963,1962,1961
This statistics in other country:
AfghanistanAlbaniaAlgeriaAmerican SamoaAngolaAntigua and BarbudaArab WorldArgentinaArmeniaArubaAustraliaAustriaAzerbaijanBahamas, TheBahrainBangladeshBarbadosBelarusBelgiumBelizeBeninBermudaBoliviaBosnia and HerzegovinaBrazilBrunei DarussalamBulgariaBurkina FasoBurundiCabo VerdeCambodiaCameroonCanadaCaribbean small statesCentral African RepublicCentral Europe and the BalticsChadChileChinaColombiaComorosCongo, Dem. Rep.Congo, Rep.Costa RicaCote d'IvoireCroatiaCubaCyprusCzech RepublicDenmarkDjiboutiDominicaDominican RepublicEarly-demographic dividendEast Asia & PacificEast Asia & Pacific (excluding high income)East Asia & Pacific (IDA & IBRD countries)EcuadorEgypt, Arab Rep.El SalvadorEquatorial GuineaEstoniaEthiopiaEuro areaEurope & Central AsiaEurope & Central Asia (excluding high income)Europe & Central Asia (IDA & IBRD countries)European UnionFaroe IslandsFijiFinlandFragile and conflict affected situationsFranceFrench PolynesiaGabonGambia, TheGeorgiaGermanyGhanaGibraltarGreeceGreenlandGrenadaGuamGuatemalaGuineaGuinea-BissauGuyanaHaitiHeavily indebted poor countries (HIPC)High incomeHondurasHong Kong SAR, ChinaHungaryIBRD onlyIcelandIDA & IBRD totalIDA blendIDA onlyIDA totalIndiaIndonesiaIran, Islamic Rep.IraqIrelandIsraelItalyJamaicaJapanJordanKazakhstanKenyaKiribatiKorea, Dem. People’s Rep.Korea, Rep.KosovoKuwaitKyrgyz RepublicLao PDRLate-demographic dividendLatin America & Caribbean Latin America & Caribbean (excluding high income)Latin America & the Caribbean (IDA & IBRD countries)LatviaLeast developed countries: UN classificationLebanonLiberiaLibyaLithuaniaLow & middle incomeLow incomeLower middle incomeLuxembourgMacao SAR, ChinaMacedonia, FYRMadagascarMalawiMalaysiaMaldivesMaliMaltaMauritaniaMauritiusMexicoMiddle East & North AfricaMiddle East & North Africa (excluding high income)Middle East & North Africa (IDA & IBRD countries)Middle incomeMoldovaMongoliaMontenegroMoroccoMozambiqueMyanmarNauruNepalNetherlandsNew CaledoniaNew ZealandNicaraguaNigerNigeriaNorth AmericaNorwayOECD membersOmanOther small statesPacific island small statesPakistanPanamaPapua New GuineaParaguayPeruPhilippinesPolandPortugalPost-demographic dividendPre-demographic dividendQatarRomaniaRussian FederationRwandaSamoaSao Tome and PrincipeSaudi ArabiaSenegalSerbiaSeychellesSierra LeoneSingaporeSlovak RepublicSloveniaSmall statesSolomon IslandsSomaliaSouth AfricaSouth AsiaSouth Asia (IDA & IBRD)SpainSri LankaSt. Kitts and NevisSt. LuciaSt. Vincent and the GrenadinesSub-Saharan Africa Sub-Saharan Africa (excluding high income)Sub-Saharan Africa (IDA & IBRD countries)SudanSurinameSwedenSwitzerlandSyrian Arab RepublicTajikistanTanzaniaThailandTogoTongaTrinidad and TobagoTunisiaTurkeyTurkmenistanTuvaluUgandaUkraineUnited Arab EmiratesUnited KingdomUnited StatesUpper middle incomeUruguayUzbekistanVanuatuVenezuela, RBVietnamWorldYemen, Rep.ZambiaZimbabwe Timeline:
This timeline shows a graph from 1961 to 2015 of Europe & Central Asia (excluding high income). No data until 1960. Number of actual observations by date: 55.
Source name:
World Development Indicators
Source organization:
World Bank staff estimates based data from International Monetary Fund's Direction of Trade database.
Categories, topics:
Private Sector, Trade
Last updated:
apr 23, 2017
Indicators value changes by year
Maximum:
45.592
jan 1, 1965
At the date of observation
Value
Absolute change
Change from previous value
jan 1, 1961
41.156
+41.156
0.0%
jan 1, 1962
39.812
-1.344
-3.27%
jan 1, 1963
39.319
-0.493
-1.24%
jan 1, 1964
40.185
+0.866
2.2%
jan 1, 1965
45.592
+5.407
13.45%
jan 1, 1966
39.071
-6.521
-14.3%
jan 1, 1967
35.652
-3.419
-8.75%
jan 1, 1968
35.945
+0.293
0.82%
jan 1, 1969
35.518
-0.427
-1.19%
jan 1, 1970
35.646
+0.128
0.36%
jan 1, 1971
36.138
+0.492
1.38%
jan 1, 1972
34.275
-1.864
-5.16%
jan 1, 1973
32.799
-1.475
-4.3%
jan 1, 1974
31.22
-1.579
-4.82%
jan 1, 1975
22.034
-9.186
-29.42%
jan 1, 1976
22.822
+0.788
3.58%
jan 1, 1977
23.668
+0.846
3.71%
jan 1, 1978
25.699
+2.031
8.58%
jan 1, 1979
27.123
+1.425
5.54%
jan 1, 1980
26.251
-0.872
-3.22%
jan 1, 1981
24.277
-1.974
-7.52%
jan 1, 1982
21.593
-2.684
-11.06%
jan 1, 1983
20.281
-1.312
-6.08%
jan 1, 1984
22.201
+1.921
9.47%
jan 1, 1985
21.185
-1.016
-4.58%
jan 1, 1986
23.598
+2.414
11.39%
jan 1, 1987
28.615
+5.016
21.26%
jan 1, 1988
27.717
-0.897
-3.14%
jan 1, 1989
28.552
+0.834
3.01%
jan 1, 1990
27.635
-0.916
-3.21%
jan 1, 1991
18.918
-8.717
-31.54%
jan 1, 1992
16.332
-2.586
-13.67%
jan 1, 1993
14.293
-2.039
-12.48%
jan 1, 1994
8.735
-5.559
-38.89%
jan 1, 1995
5.142
-3.593
-41.14%
jan 1, 1996
6.053
+0.912
17.73%
jan 1, 1997
2.979
-3.075
-50.79%
jan 1, 1998
1.631
-1.347
-45.23%
jan 1, 1999
1.54
-0.092
-5.61%
jan 1, 2000
2.379
+0.84
54.53%
jan 1, 2001
2.192
-0.187
-7.88%
jan 1, 2002
1.866
-0.327
-14.9%
jan 1, 2003
2.137
+0.271
14.54%
jan 1, 2004
1.904
-0.233
-10.91%
jan 1, 2005
1.046
-0.858
-45.06%
jan 1, 2006
1.034
-0.012
-1.17%
jan 1, 2007
1.098
+0.064
6.23%
jan 1, 2008
0.742
-0.356
-32.41%
jan 1, 2009
0.833
+0.09
12.18%
jan 1, 2010
1.837
+1.004
120.57%
jan 1, 2011
1.651
-0.186
-10.12%
jan 1, 2012
7.173
+5.523
334.57%
jan 1, 2013
2.421
-4.752
-66.24%
jan 1, 2014
2.581
+0.159
6.58%
jan 1, 2015
2.853
+0.272
10.56%
Ranking of countries by current statistics by years


Comments: