29
/
en
AIzaSyAYiBZKx7MnpbEhh9jyipgxe19OcubqV5w
April 1, 2024
165125
Jordan
JOR
true
2
1
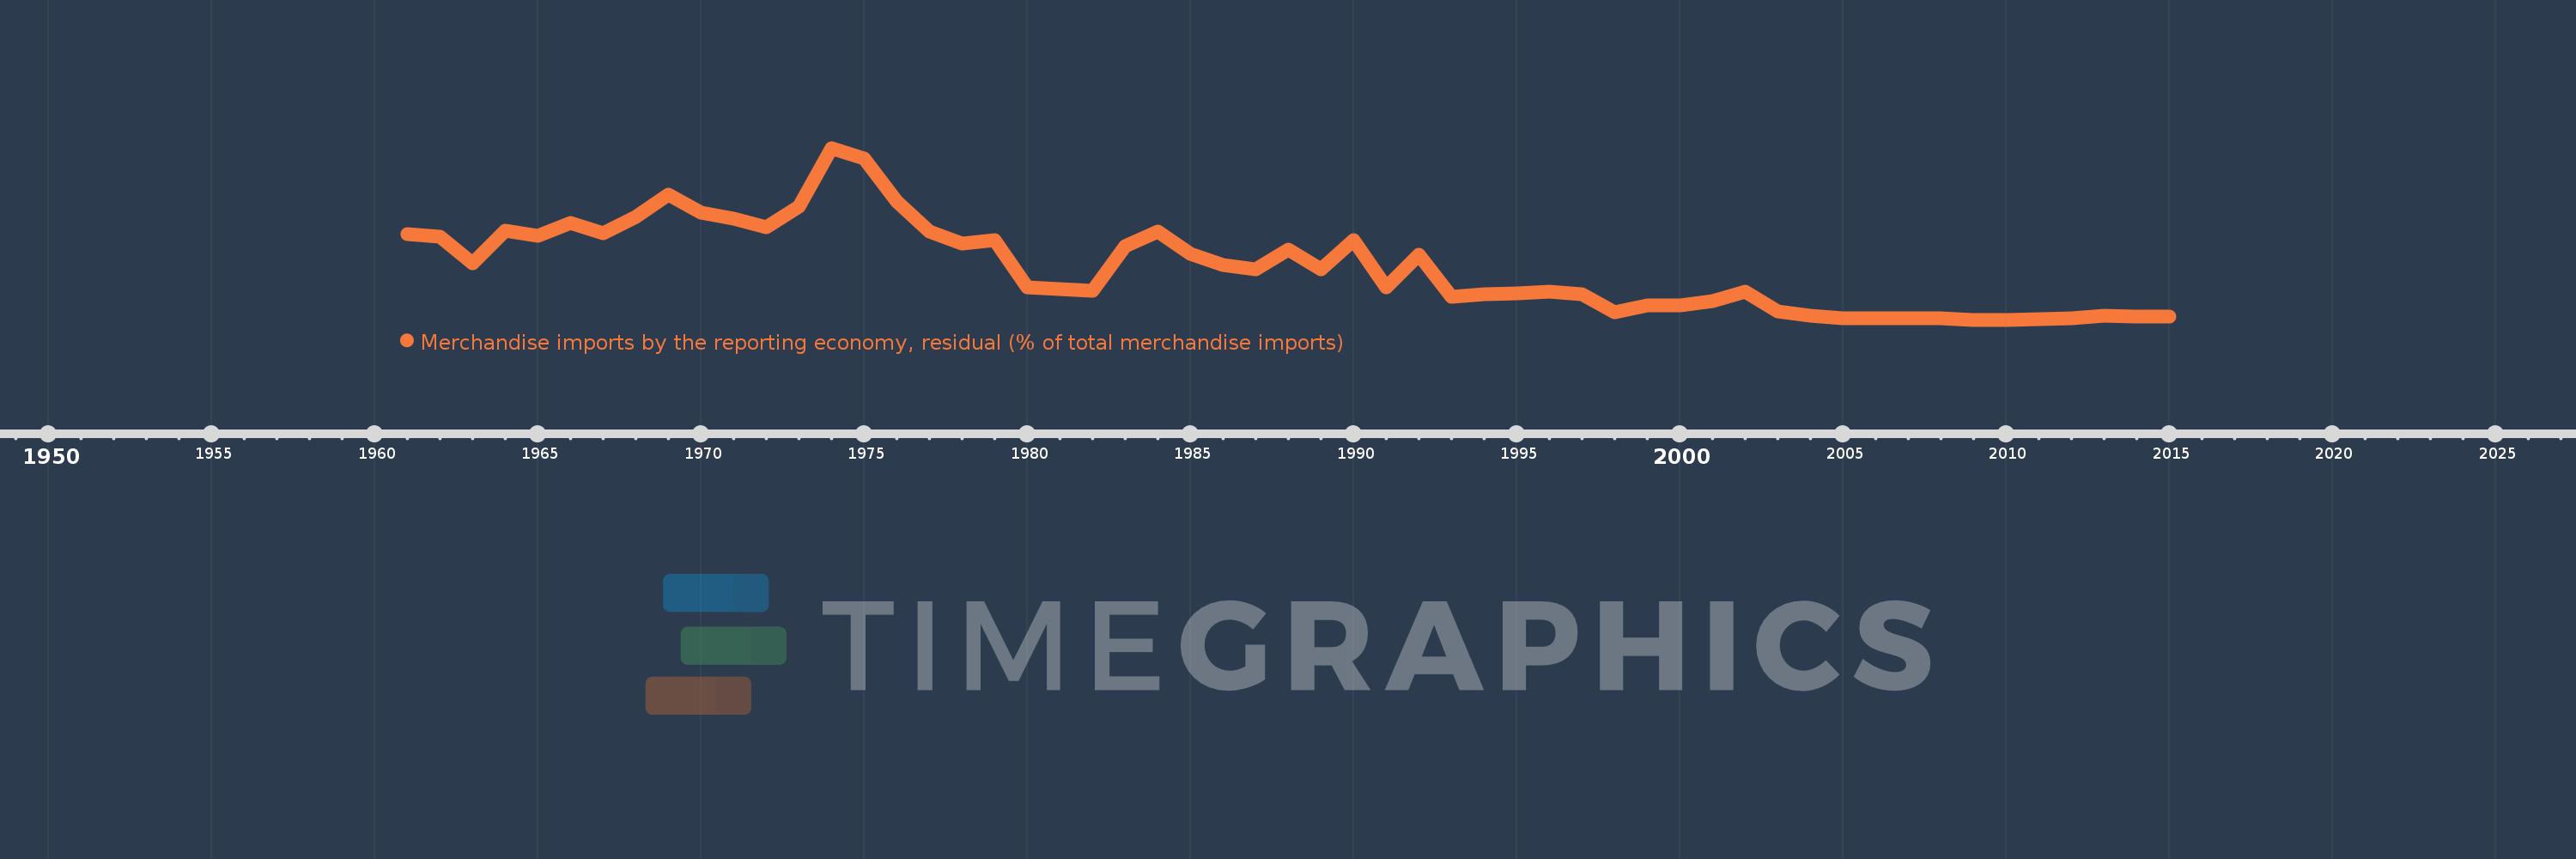
Merchandise imports by the reporting economy, residual (% of total merchandise imports)
2015,2014,2013,2012,2011,2010,2009,2008,2007,2006,2005,2004,2003,2002,2001,2000,1999,1998,1997,1996,1995,1994,1993,1992,1991,1990,1989,1988,1987,1986,1985,1984,1983,1982,1981,1980,1979,1978,1977,1976,1975,1974,1973,1972,1971,1970,1969,1968,1967,1966,1965,1964,1963,1962,1961
This statistics in other country:
AfghanistanAlbaniaAlgeriaAmerican SamoaAngolaAntigua and BarbudaArab WorldArgentinaArmeniaArubaAustraliaAustriaAzerbaijanBahamas, TheBahrainBangladeshBarbadosBelarusBelgiumBelizeBeninBermudaBoliviaBosnia and HerzegovinaBrazilBrunei DarussalamBulgariaBurkina FasoBurundiCabo VerdeCambodiaCameroonCanadaCaribbean small statesCentral African RepublicCentral Europe and the BalticsChadChileChinaColombiaComorosCongo, Dem. Rep.Congo, Rep.Costa RicaCote d'IvoireCroatiaCubaCyprusCzech RepublicDenmarkDjiboutiDominicaDominican RepublicEarly-demographic dividendEast Asia & PacificEast Asia & Pacific (excluding high income)East Asia & Pacific (IDA & IBRD countries)EcuadorEgypt, Arab Rep.El SalvadorEquatorial GuineaEstoniaEthiopiaEuro areaEurope & Central AsiaEurope & Central Asia (excluding high income)Europe & Central Asia (IDA & IBRD countries)European UnionFaroe IslandsFijiFinlandFragile and conflict affected situationsFranceFrench PolynesiaGabonGambia, TheGeorgiaGermanyGhanaGibraltarGreeceGreenlandGrenadaGuamGuatemalaGuineaGuinea-BissauGuyanaHaitiHeavily indebted poor countries (HIPC)High incomeHondurasHong Kong SAR, ChinaHungaryIBRD onlyIcelandIDA & IBRD totalIDA blendIDA onlyIDA totalIndiaIndonesiaIran, Islamic Rep.IraqIrelandIsraelItalyJamaicaJapanJordanKazakhstanKenyaKiribatiKorea, Dem. People’s Rep.Korea, Rep.KosovoKuwaitKyrgyz RepublicLao PDRLate-demographic dividendLatin America & Caribbean Latin America & Caribbean (excluding high income)Latin America & the Caribbean (IDA & IBRD countries)LatviaLeast developed countries: UN classificationLebanonLiberiaLibyaLithuaniaLow & middle incomeLow incomeLower middle incomeLuxembourgMacao SAR, ChinaMacedonia, FYRMadagascarMalawiMalaysiaMaldivesMaliMaltaMauritaniaMauritiusMexicoMiddle East & North AfricaMiddle East & North Africa (excluding high income)Middle East & North Africa (IDA & IBRD countries)Middle incomeMoldovaMongoliaMontenegroMoroccoMozambiqueMyanmarNauruNepalNetherlandsNew CaledoniaNew ZealandNicaraguaNigerNigeriaNorth AmericaNorwayOECD membersOmanOther small statesPacific island small statesPakistanPanamaPapua New GuineaParaguayPeruPhilippinesPolandPortugalPost-demographic dividendPre-demographic dividendQatarRomaniaRussian FederationRwandaSamoaSao Tome and PrincipeSaudi ArabiaSenegalSerbiaSeychellesSierra LeoneSingaporeSlovak RepublicSloveniaSmall statesSolomon IslandsSomaliaSouth AfricaSouth AsiaSouth Asia (IDA & IBRD)SpainSri LankaSt. Kitts and NevisSt. LuciaSt. Vincent and the GrenadinesSub-Saharan Africa Sub-Saharan Africa (excluding high income)Sub-Saharan Africa (IDA & IBRD countries)SudanSurinameSwedenSwitzerlandSyrian Arab RepublicTajikistanTanzaniaThailandTogoTongaTrinidad and TobagoTunisiaTurkeyTurkmenistanTuvaluUgandaUkraineUnited Arab EmiratesUnited KingdomUnited StatesUpper middle incomeUruguayUzbekistanVanuatuVenezuela, RBVietnamWorldYemen, Rep.ZambiaZimbabwe Timeline:
This timeline shows a graph from 1961 to 2015 of Jordan. No data until 1960. Number of actual observations by date: 55.
Source name:
World Development Indicators
Source organization:
World Bank staff estimates based data from International Monetary Fund's Direction of Trade database.
Categories, topics:
Private Sector, Trade
Last updated:
apr 23, 2017
Indicators value changes by year
Maximum:
26.461
jan 1, 1974
At the date of observation
Value
Absolute change
Change from previous value
jan 1, 1961
13.261
+13.261
0.0%
jan 1, 1962
12.876
-0.386
-2.91%
jan 1, 1963
8.768
-4.108
-31.9%
jan 1, 1964
13.678
+4.91
56.01%
jan 1, 1965
12.968
-0.71
-5.19%
jan 1, 1966
14.987
+2.019
15.57%
jan 1, 1967
13.398
-1.589
-10.6%
jan 1, 1968
15.876
+2.478
18.49%
jan 1, 1969
19.257
+3.381
21.3%
jan 1, 1970
16.446
-2.811
-14.6%
jan 1, 1971
15.555
-0.891
-5.42%
jan 1, 1972
14.282
-1.273
-8.18%
jan 1, 1973
17.474
+3.192
22.35%
jan 1, 1974
26.461
+8.987
51.43%
jan 1, 1975
24.781
-1.68
-6.35%
jan 1, 1976
18.286
-6.495
-26.21%
jan 1, 1977
13.628
-4.658
-25.47%
jan 1, 1978
11.72
-1.908
-14.0%
jan 1, 1979
12.245
+0.525
4.48%
jan 1, 1980
5.013
-7.233
-59.06%
jan 1, 1981
4.705
-0.308
-6.14%
jan 1, 1982
4.428
-0.277
-5.89%
jan 1, 1983
11.352
+6.924
156.37%
jan 1, 1984
13.602
+2.25
19.82%
jan 1, 1985
10.137
-3.465
-25.48%
jan 1, 1986
8.403
-1.734
-17.11%
jan 1, 1987
7.827
-0.576
-6.85%
jan 1, 1988
10.894
+3.067
39.19%
jan 1, 1989
7.848
-3.047
-27.96%
jan 1, 1990
12.325
+4.477
57.05%
jan 1, 1991
4.981
-7.344
-59.59%
jan 1, 1992
10.038
+5.057
101.53%
jan 1, 1993
3.518
-6.52
-64.96%
jan 1, 1994
3.899
+0.381
10.84%
jan 1, 1995
4.103
+0.204
5.23%
jan 1, 1996
4.408
+0.305
7.43%
jan 1, 1997
4.013
-0.394
-8.95%
jan 1, 1998
1.204
-2.81
-70.01%
jan 1, 1999
2.277
+1.074
89.21%
jan 1, 2000
2.212
-0.066
-2.88%
jan 1, 2001
2.944
+0.733
33.12%
jan 1, 2002
4.4
+1.455
49.42%
jan 1, 2003
1.254
-3.146
-71.51%
jan 1, 2004
0.645
-0.609
-48.58%
jan 1, 2005
0.273
-0.371
-57.57%
jan 1, 2006
0.258
-0.016
-5.77%
jan 1, 2007
0.296
+0.039
15.0%
jan 1, 2008
0.252
-0.045
-15.02%
jan 1, 2009
0.032
-0.22
-87.48%
jan 1, 2010
0.035
+0.004
11.11%
jan 1, 2011
0.181
+0.146
416.29%
jan 1, 2012
0.282
+0.101
55.75%
jan 1, 2013
0.623
+0.341
121.08%
jan 1, 2014
0.468
-0.155
-24.9%
jan 1, 2015
0.477
+0.009
1.92%
Ranking of countries by current statistics by years


Comments: