29
/
en
AIzaSyAYiBZKx7MnpbEhh9jyipgxe19OcubqV5w
April 1, 2024
133401
Finland
FIN
true
2
1
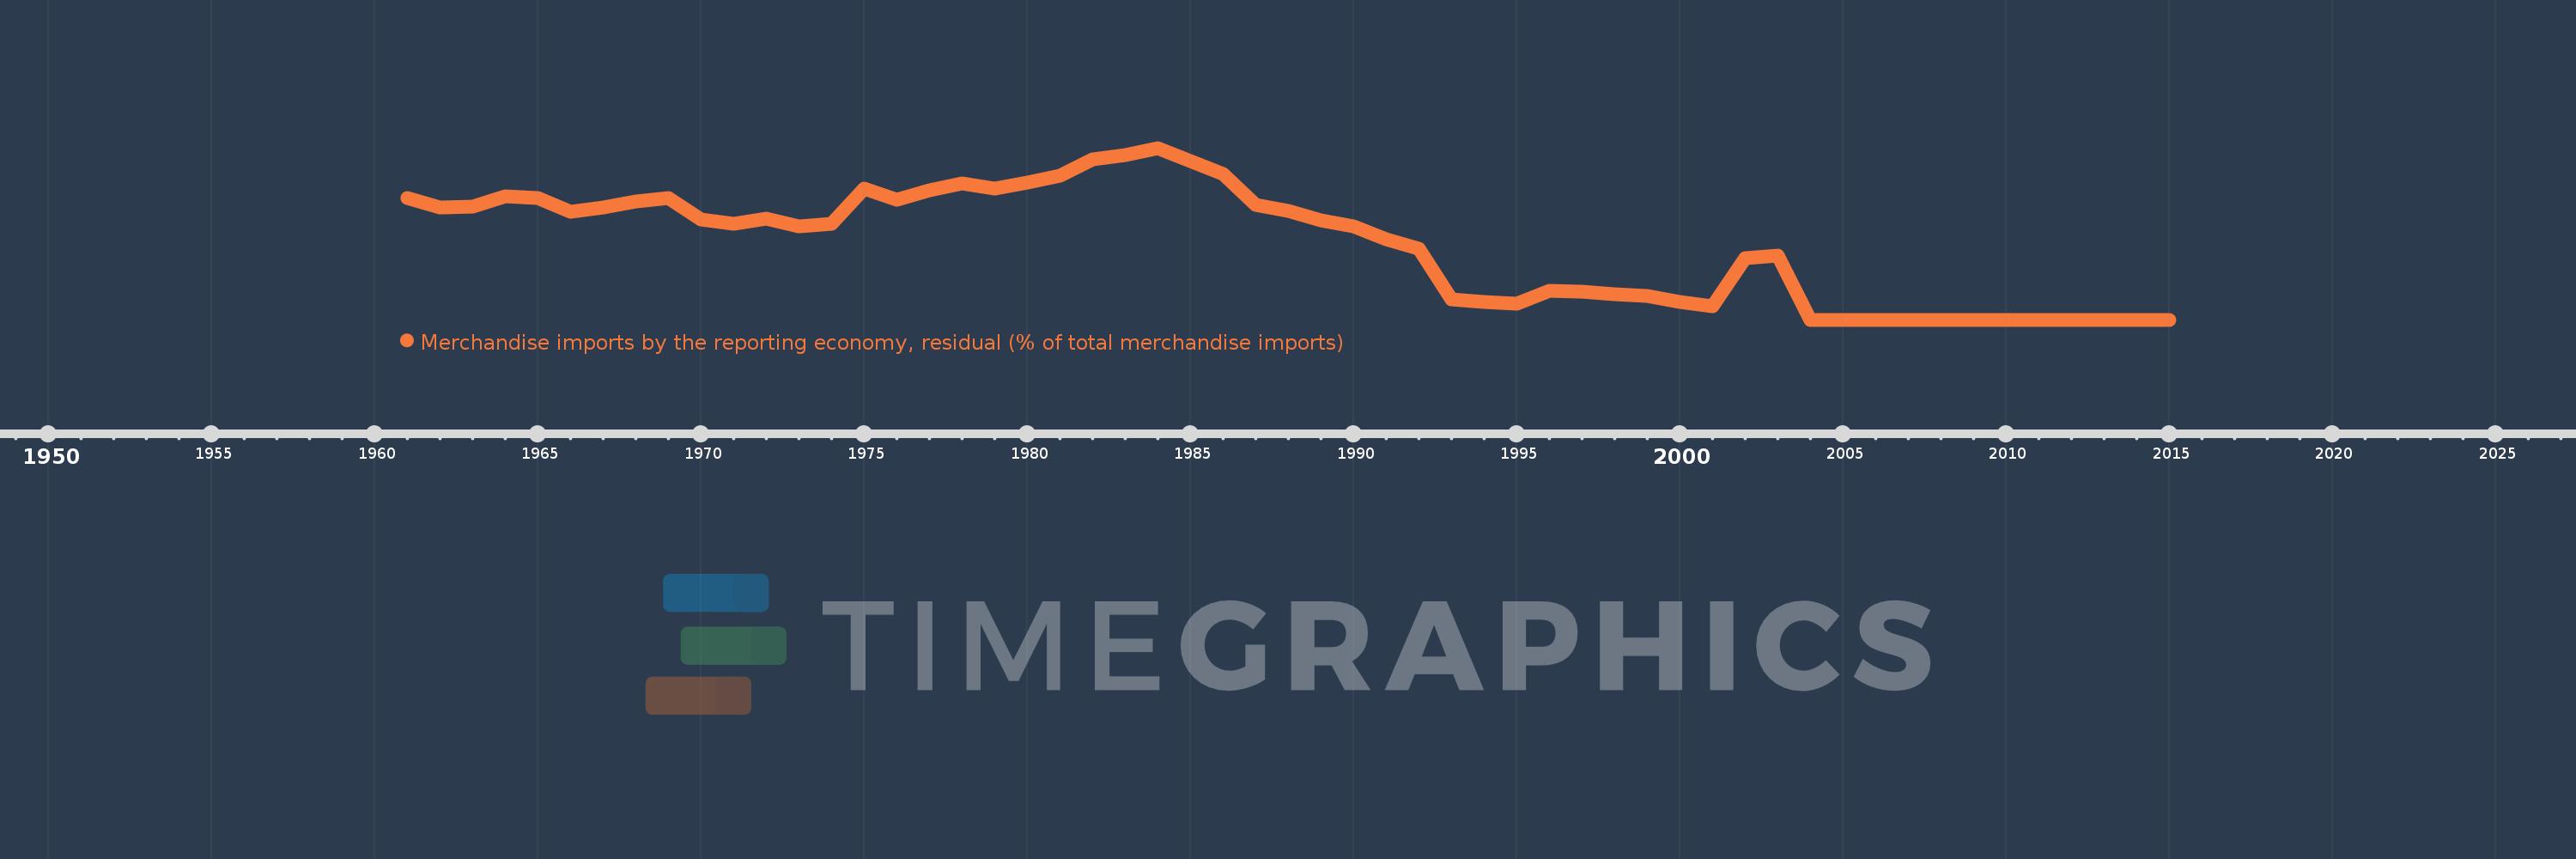
Merchandise imports by the reporting economy, residual (% of total merchandise imports)
2015,2014,2013,2012,2011,2010,2009,2008,2007,2006,2005,2004,2003,2002,2001,2000,1999,1998,1997,1996,1995,1994,1993,1992,1991,1990,1989,1988,1987,1986,1985,1984,1983,1982,1981,1980,1979,1978,1977,1976,1975,1974,1973,1972,1971,1970,1969,1968,1967,1966,1965,1964,1963,1962,1961
This statistics in other country:
AfghanistanAlbaniaAlgeriaAmerican SamoaAngolaAntigua and BarbudaArab WorldArgentinaArmeniaArubaAustraliaAustriaAzerbaijanBahamas, TheBahrainBangladeshBarbadosBelarusBelgiumBelizeBeninBermudaBoliviaBosnia and HerzegovinaBrazilBrunei DarussalamBulgariaBurkina FasoBurundiCabo VerdeCambodiaCameroonCanadaCaribbean small statesCentral African RepublicCentral Europe and the BalticsChadChileChinaColombiaComorosCongo, Dem. Rep.Congo, Rep.Costa RicaCote d'IvoireCroatiaCubaCyprusCzech RepublicDenmarkDjiboutiDominicaDominican RepublicEarly-demographic dividendEast Asia & PacificEast Asia & Pacific (excluding high income)East Asia & Pacific (IDA & IBRD countries)EcuadorEgypt, Arab Rep.El SalvadorEquatorial GuineaEstoniaEthiopiaEuro areaEurope & Central AsiaEurope & Central Asia (excluding high income)Europe & Central Asia (IDA & IBRD countries)European UnionFaroe IslandsFijiFinlandFragile and conflict affected situationsFranceFrench PolynesiaGabonGambia, TheGeorgiaGermanyGhanaGibraltarGreeceGreenlandGrenadaGuamGuatemalaGuineaGuinea-BissauGuyanaHaitiHeavily indebted poor countries (HIPC)High incomeHondurasHong Kong SAR, ChinaHungaryIBRD onlyIcelandIDA & IBRD totalIDA blendIDA onlyIDA totalIndiaIndonesiaIran, Islamic Rep.IraqIrelandIsraelItalyJamaicaJapanJordanKazakhstanKenyaKiribatiKorea, Dem. People’s Rep.Korea, Rep.KosovoKuwaitKyrgyz RepublicLao PDRLate-demographic dividendLatin America & Caribbean Latin America & Caribbean (excluding high income)Latin America & the Caribbean (IDA & IBRD countries)LatviaLeast developed countries: UN classificationLebanonLiberiaLibyaLithuaniaLow & middle incomeLow incomeLower middle incomeLuxembourgMacao SAR, ChinaMacedonia, FYRMadagascarMalawiMalaysiaMaldivesMaliMaltaMauritaniaMauritiusMexicoMiddle East & North AfricaMiddle East & North Africa (excluding high income)Middle East & North Africa (IDA & IBRD countries)Middle incomeMoldovaMongoliaMontenegroMoroccoMozambiqueMyanmarNauruNepalNetherlandsNew CaledoniaNew ZealandNicaraguaNigerNigeriaNorth AmericaNorwayOECD membersOmanOther small statesPacific island small statesPakistanPanamaPapua New GuineaParaguayPeruPhilippinesPolandPortugalPost-demographic dividendPre-demographic dividendQatarRomaniaRussian FederationRwandaSamoaSao Tome and PrincipeSaudi ArabiaSenegalSerbiaSeychellesSierra LeoneSingaporeSlovak RepublicSloveniaSmall statesSolomon IslandsSomaliaSouth AfricaSouth AsiaSouth Asia (IDA & IBRD)SpainSri LankaSt. Kitts and NevisSt. LuciaSt. Vincent and the GrenadinesSub-Saharan Africa Sub-Saharan Africa (excluding high income)Sub-Saharan Africa (IDA & IBRD countries)SudanSurinameSwedenSwitzerlandSyrian Arab RepublicTajikistanTanzaniaThailandTogoTongaTrinidad and TobagoTunisiaTurkeyTurkmenistanTuvaluUgandaUkraineUnited Arab EmiratesUnited KingdomUnited StatesUpper middle incomeUruguayUzbekistanVanuatuVenezuela, RBVietnamWorldYemen, Rep.ZambiaZimbabwe Timeline:
This timeline shows a graph from 1961 to 2015 of Finland. No data until 1960. Number of actual observations by date: 55.
Source name:
World Development Indicators
Source organization:
World Bank staff estimates based data from International Monetary Fund's Direction of Trade database.
Categories, topics:
Private Sector, Trade
Last updated:
apr 23, 2017
Indicators value changes by year
Maximum:
28.505
jan 1, 1984
At the date of observation
Value
Absolute change
Change from previous value
jan 1, 1961
20.249
+20.249
0.0%
jan 1, 1962
18.67
-1.579
-7.8%
jan 1, 1963
18.716
+0.047
0.25%
jan 1, 1964
20.496
+1.779
9.51%
jan 1, 1965
20.224
-0.271
-1.32%
jan 1, 1966
17.943
-2.282
-11.28%
jan 1, 1967
18.685
+0.742
4.13%
jan 1, 1968
19.587
+0.903
4.83%
jan 1, 1969
20.226
+0.639
3.26%
jan 1, 1970
16.566
-3.66
-18.1%
jan 1, 1971
15.908
-0.658
-3.97%
jan 1, 1972
16.807
+0.9
5.65%
jan 1, 1973
15.561
-1.246
-7.41%
jan 1, 1974
15.904
+0.343
2.21%
jan 1, 1975
21.695
+5.79
36.41%
jan 1, 1976
19.917
-1.777
-8.19%
jan 1, 1977
21.412
+1.495
7.51%
jan 1, 1978
22.59
+1.178
5.5%
jan 1, 1979
21.828
-0.762
-3.37%
jan 1, 1980
22.76
+0.932
4.27%
jan 1, 1981
23.972
+1.212
5.33%
jan 1, 1982
26.58
+2.607
10.88%
jan 1, 1983
27.32
+0.741
2.79%
jan 1, 1984
28.505
+1.185
4.34%
jan 1, 1985
26.33
-2.176
-7.63%
jan 1, 1986
24.116
-2.214
-8.41%
jan 1, 1987
19.11
-5.005
-20.76%
jan 1, 1988
18.017
-1.093
-5.72%
jan 1, 1989
16.511
-1.506
-8.36%
jan 1, 1990
15.473
-1.038
-6.29%
jan 1, 1991
13.422
-2.051
-13.26%
jan 1, 1992
11.732
-1.69
-12.59%
jan 1, 1993
3.383
-8.35
-71.17%
jan 1, 1994
2.972
-0.411
-12.14%
jan 1, 1995
2.731
-0.241
-8.1%
jan 1, 1996
4.818
+2.087
76.42%
jan 1, 1997
4.688
-0.13
-2.7%
jan 1, 1998
4.163
-0.525
-11.2%
jan 1, 1999
3.9
-0.264
-6.33%
jan 1, 2000
3.018
-0.882
-22.62%
jan 1, 2001
2.271
-0.746
-24.73%
jan 1, 2002
10.272
+8.001
352.24%
jan 1, 2003
10.634
+0.362
3.53%
jan 1, 2004
0.01
-10.624
-99.91%
jan 1, 2005
0.013
+0.003
31.41%
jan 1, 2006
0.004
-0.009
-67.7%
jan 1, 2007
0.002
-0.003
-61.29%
jan 1, 2008
0.015
+0.014
841.84%
jan 1, 2009
0.012
-0.003
-18.2%
jan 1, 2010
0.0
-0.012
-97.46%
jan 1, 2011
0.002
+0.001
410.17%
jan 1, 2012
0.0
-0.001
-91.4%
jan 1, 2013
0.0
+0.0
123.45%
jan 1, 2014
0.0
0.0
-80.8%
jan 1, 2015
0.001
+0.001
1.15K%
Ranking of countries by current statistics by years


Comments: