29
/
en
AIzaSyAYiBZKx7MnpbEhh9jyipgxe19OcubqV5w
April 1, 2024
268278
Tunisia
TUN
true
2
1
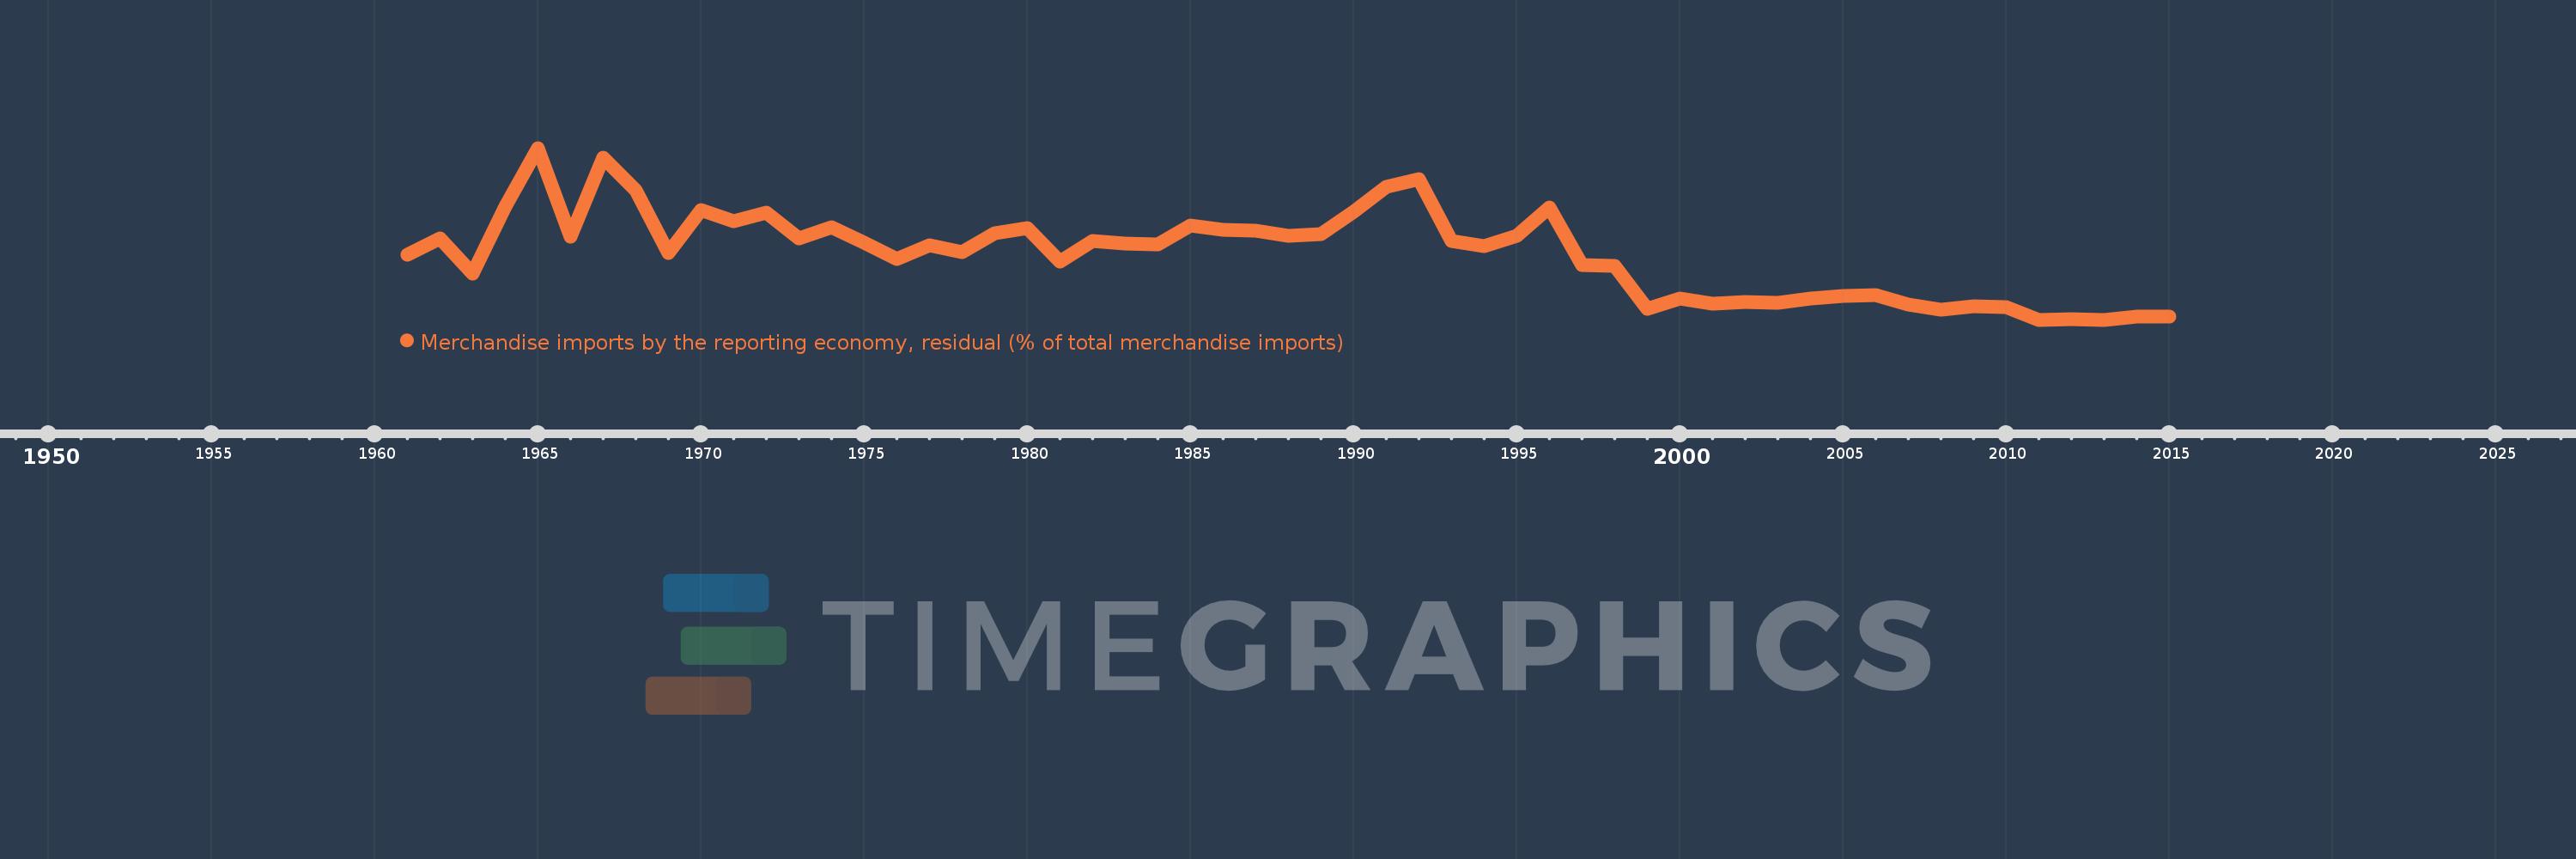
Merchandise imports by the reporting economy, residual (% of total merchandise imports)
2015,2014,2013,2012,2011,2010,2009,2008,2007,2006,2005,2004,2003,2002,2001,2000,1999,1998,1997,1996,1995,1994,1993,1992,1991,1990,1989,1988,1987,1986,1985,1984,1983,1982,1981,1980,1979,1978,1977,1976,1975,1974,1973,1972,1971,1970,1969,1968,1967,1966,1965,1964,1963,1962,1961
This statistics in other country:
AfghanistanAlbaniaAlgeriaAmerican SamoaAngolaAntigua and BarbudaArab WorldArgentinaArmeniaArubaAustraliaAustriaAzerbaijanBahamas, TheBahrainBangladeshBarbadosBelarusBelgiumBelizeBeninBermudaBoliviaBosnia and HerzegovinaBrazilBrunei DarussalamBulgariaBurkina FasoBurundiCabo VerdeCambodiaCameroonCanadaCaribbean small statesCentral African RepublicCentral Europe and the BalticsChadChileChinaColombiaComorosCongo, Dem. Rep.Congo, Rep.Costa RicaCote d'IvoireCroatiaCubaCyprusCzech RepublicDenmarkDjiboutiDominicaDominican RepublicEarly-demographic dividendEast Asia & PacificEast Asia & Pacific (excluding high income)East Asia & Pacific (IDA & IBRD countries)EcuadorEgypt, Arab Rep.El SalvadorEquatorial GuineaEstoniaEthiopiaEuro areaEurope & Central AsiaEurope & Central Asia (excluding high income)Europe & Central Asia (IDA & IBRD countries)European UnionFaroe IslandsFijiFinlandFragile and conflict affected situationsFranceFrench PolynesiaGabonGambia, TheGeorgiaGermanyGhanaGibraltarGreeceGreenlandGrenadaGuamGuatemalaGuineaGuinea-BissauGuyanaHaitiHeavily indebted poor countries (HIPC)High incomeHondurasHong Kong SAR, ChinaHungaryIBRD onlyIcelandIDA & IBRD totalIDA blendIDA onlyIDA totalIndiaIndonesiaIran, Islamic Rep.IraqIrelandIsraelItalyJamaicaJapanJordanKazakhstanKenyaKiribatiKorea, Dem. People’s Rep.Korea, Rep.KosovoKuwaitKyrgyz RepublicLao PDRLate-demographic dividendLatin America & Caribbean Latin America & Caribbean (excluding high income)Latin America & the Caribbean (IDA & IBRD countries)LatviaLeast developed countries: UN classificationLebanonLiberiaLibyaLithuaniaLow & middle incomeLow incomeLower middle incomeLuxembourgMacao SAR, ChinaMacedonia, FYRMadagascarMalawiMalaysiaMaldivesMaliMaltaMauritaniaMauritiusMexicoMiddle East & North AfricaMiddle East & North Africa (excluding high income)Middle East & North Africa (IDA & IBRD countries)Middle incomeMoldovaMongoliaMontenegroMoroccoMozambiqueMyanmarNauruNepalNetherlandsNew CaledoniaNew ZealandNicaraguaNigerNigeriaNorth AmericaNorwayOECD membersOmanOther small statesPacific island small statesPakistanPanamaPapua New GuineaParaguayPeruPhilippinesPolandPortugalPost-demographic dividendPre-demographic dividendQatarRomaniaRussian FederationRwandaSamoaSao Tome and PrincipeSaudi ArabiaSenegalSerbiaSeychellesSierra LeoneSingaporeSlovak RepublicSloveniaSmall statesSolomon IslandsSomaliaSouth AfricaSouth AsiaSouth Asia (IDA & IBRD)SpainSri LankaSt. Kitts and NevisSt. LuciaSt. Vincent and the GrenadinesSub-Saharan Africa Sub-Saharan Africa (excluding high income)Sub-Saharan Africa (IDA & IBRD countries)SudanSurinameSwedenSwitzerlandSyrian Arab RepublicTajikistanTanzaniaThailandTogoTongaTrinidad and TobagoTunisiaTurkeyTurkmenistanTuvaluUgandaUkraineUnited Arab EmiratesUnited KingdomUnited StatesUpper middle incomeUruguayUzbekistanVanuatuVenezuela, RBVietnamWorldYemen, Rep.ZambiaZimbabwe Timeline:
This timeline shows a graph from 1961 to 2015 of Tunisia. No data until 1960. Number of actual observations by date: 55.
Source name:
World Development Indicators
Source organization:
World Bank staff estimates based data from International Monetary Fund's Direction of Trade database.
Categories, topics:
Private Sector, Trade
Last updated:
apr 23, 2017
Indicators value changes by year
Maximum:
15.663
jan 1, 1965
At the date of observation
Value
Absolute change
Change from previous value
jan 1, 1961
6.018
+6.018
0.0%
jan 1, 1962
7.427
+1.409
23.41%
jan 1, 1963
4.229
-3.198
-43.06%
jan 1, 1964
10.374
+6.146
145.34%
jan 1, 1965
15.663
+5.288
50.97%
jan 1, 1966
7.599
-8.064
-51.49%
jan 1, 1967
14.806
+7.207
94.85%
jan 1, 1968
11.859
-2.947
-19.9%
jan 1, 1969
6.152
-5.707
-48.12%
jan 1, 1970
10.029
+3.877
63.01%
jan 1, 1971
9.047
-0.982
-9.79%
jan 1, 1972
9.775
+0.728
8.05%
jan 1, 1973
7.453
-2.322
-23.75%
jan 1, 1974
8.498
+1.045
14.02%
jan 1, 1975
7.091
-1.408
-16.56%
jan 1, 1976
5.588
-1.503
-21.2%
jan 1, 1977
6.815
+1.228
21.97%
jan 1, 1978
6.218
-0.598
-8.77%
jan 1, 1979
7.94
+1.722
27.69%
jan 1, 1980
8.356
+0.416
5.24%
jan 1, 1981
5.32
-3.036
-36.33%
jan 1, 1982
7.212
+1.891
35.55%
jan 1, 1983
6.996
-0.215
-2.99%
jan 1, 1984
6.879
-0.117
-1.67%
jan 1, 1985
8.642
+1.762
25.62%
jan 1, 1986
8.229
-0.412
-4.77%
jan 1, 1987
8.159
-0.07
-0.85%
jan 1, 1988
7.687
-0.472
-5.79%
jan 1, 1989
7.84
+0.153
1.99%
jan 1, 1990
9.89
+2.05
26.15%
jan 1, 1991
12.172
+2.282
23.08%
jan 1, 1992
12.852
+0.68
5.59%
jan 1, 1993
7.216
-5.637
-43.86%
jan 1, 1994
6.739
-0.477
-6.61%
jan 1, 1995
7.688
+0.949
14.09%
jan 1, 1996
10.284
+2.596
33.76%
jan 1, 1997
5.017
-5.266
-51.21%
jan 1, 1998
4.933
-0.084
-1.68%
jan 1, 1999
1.094
-3.839
-77.82%
jan 1, 2000
1.993
+0.899
82.16%
jan 1, 2001
1.551
-0.442
-22.17%
jan 1, 2002
1.668
+0.117
7.52%
jan 1, 2003
1.597
-0.071
-4.26%
jan 1, 2004
1.971
+0.375
23.45%
jan 1, 2005
2.261
+0.29
14.71%
jan 1, 2006
2.341
+0.079
3.5%
jan 1, 2007
1.444
-0.896
-38.3%
jan 1, 2008
1.008
-0.436
-30.22%
jan 1, 2009
1.323
+0.315
31.25%
jan 1, 2010
1.225
-0.097
-7.35%
jan 1, 2011
0.09
-1.136
-92.66%
jan 1, 2012
0.157
+0.067
74.9%
jan 1, 2013
0.083
-0.074
-47.33%
jan 1, 2014
0.336
+0.253
306.07%
jan 1, 2015
0.342
+0.006
1.8%
Ranking of countries by current statistics by years


Comments: