29
/
en
AIzaSyAYiBZKx7MnpbEhh9jyipgxe19OcubqV5w
April 1, 2024
251026
St. Lucia
LCA
true
2
1
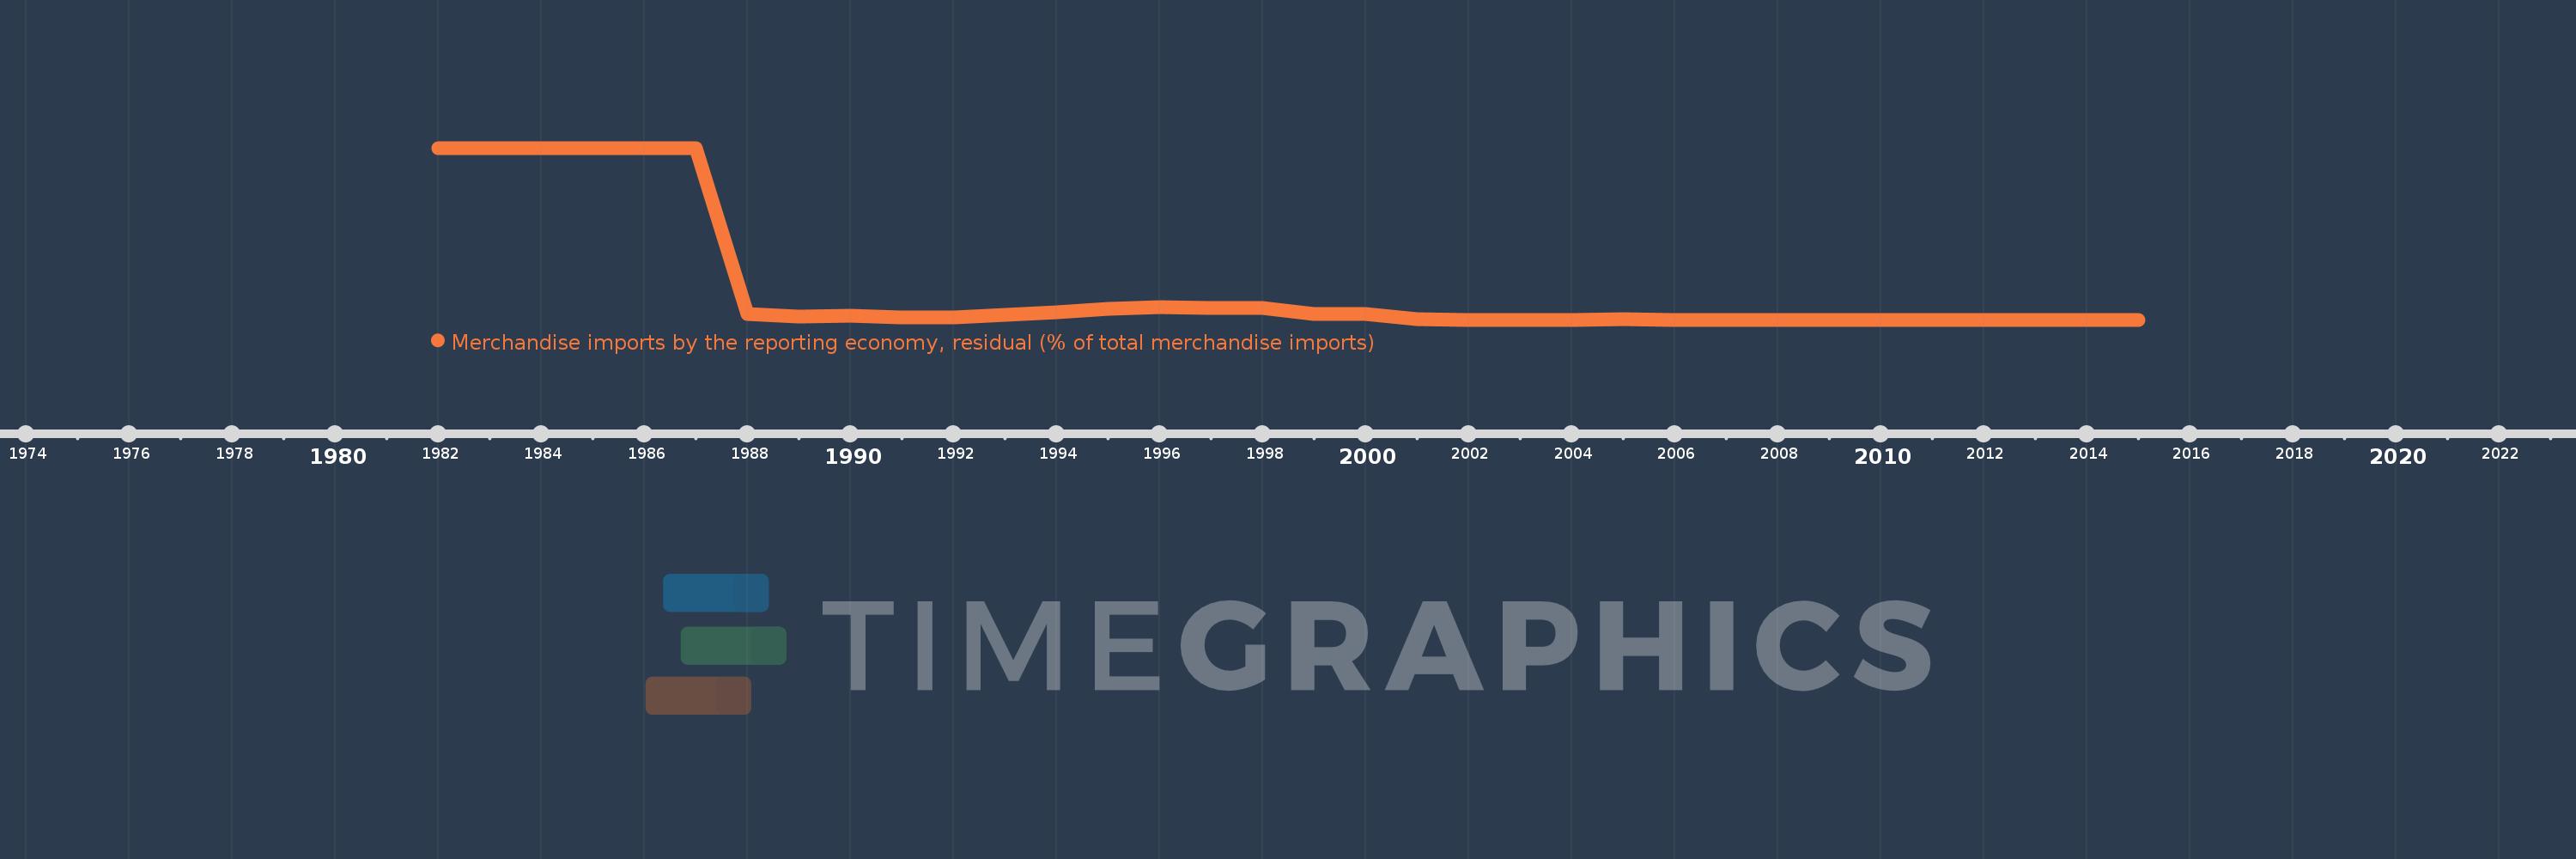
Merchandise imports by the reporting economy, residual (% of total merchandise imports)
2015,2014,2013,2012,2011,2010,2009,2008,2007,2006,2005,2004,2003,2002,2001,2000,1999,1998,1997,1996,1995,1994,1993,1992,1991,1990,1989,1988,1987,1986,1985,1984,1983,1982
This statistics in other country:
AfghanistanAlbaniaAlgeriaAmerican SamoaAngolaAntigua and BarbudaArab WorldArgentinaArmeniaArubaAustraliaAustriaAzerbaijanBahamas, TheBahrainBangladeshBarbadosBelarusBelgiumBelizeBeninBermudaBoliviaBosnia and HerzegovinaBrazilBrunei DarussalamBulgariaBurkina FasoBurundiCabo VerdeCambodiaCameroonCanadaCaribbean small statesCentral African RepublicCentral Europe and the BalticsChadChileChinaColombiaComorosCongo, Dem. Rep.Congo, Rep.Costa RicaCote d'IvoireCroatiaCubaCyprusCzech RepublicDenmarkDjiboutiDominicaDominican RepublicEarly-demographic dividendEast Asia & PacificEast Asia & Pacific (excluding high income)East Asia & Pacific (IDA & IBRD countries)EcuadorEgypt, Arab Rep.El SalvadorEquatorial GuineaEstoniaEthiopiaEuro areaEurope & Central AsiaEurope & Central Asia (excluding high income)Europe & Central Asia (IDA & IBRD countries)European UnionFaroe IslandsFijiFinlandFragile and conflict affected situationsFranceFrench PolynesiaGabonGambia, TheGeorgiaGermanyGhanaGibraltarGreeceGreenlandGrenadaGuamGuatemalaGuineaGuinea-BissauGuyanaHaitiHeavily indebted poor countries (HIPC)High incomeHondurasHong Kong SAR, ChinaHungaryIBRD onlyIcelandIDA & IBRD totalIDA blendIDA onlyIDA totalIndiaIndonesiaIran, Islamic Rep.IraqIrelandIsraelItalyJamaicaJapanJordanKazakhstanKenyaKiribatiKorea, Dem. People’s Rep.Korea, Rep.KosovoKuwaitKyrgyz RepublicLao PDRLate-demographic dividendLatin America & Caribbean Latin America & Caribbean (excluding high income)Latin America & the Caribbean (IDA & IBRD countries)LatviaLeast developed countries: UN classificationLebanonLiberiaLibyaLithuaniaLow & middle incomeLow incomeLower middle incomeLuxembourgMacao SAR, ChinaMacedonia, FYRMadagascarMalawiMalaysiaMaldivesMaliMaltaMauritaniaMauritiusMexicoMiddle East & North AfricaMiddle East & North Africa (excluding high income)Middle East & North Africa (IDA & IBRD countries)Middle incomeMoldovaMongoliaMontenegroMoroccoMozambiqueMyanmarNauruNepalNetherlandsNew CaledoniaNew ZealandNicaraguaNigerNigeriaNorth AmericaNorwayOECD membersOmanOther small statesPacific island small statesPakistanPanamaPapua New GuineaParaguayPeruPhilippinesPolandPortugalPost-demographic dividendPre-demographic dividendQatarRomaniaRussian FederationRwandaSamoaSao Tome and PrincipeSaudi ArabiaSenegalSerbiaSeychellesSierra LeoneSingaporeSlovak RepublicSloveniaSmall statesSolomon IslandsSomaliaSouth AfricaSouth AsiaSouth Asia (IDA & IBRD)SpainSri LankaSt. Kitts and NevisSt. LuciaSt. Vincent and the GrenadinesSub-Saharan Africa Sub-Saharan Africa (excluding high income)Sub-Saharan Africa (IDA & IBRD countries)SudanSurinameSwedenSwitzerlandSyrian Arab RepublicTajikistanTanzaniaThailandTogoTongaTrinidad and TobagoTunisiaTurkeyTurkmenistanTuvaluUgandaUkraineUnited Arab EmiratesUnited KingdomUnited StatesUpper middle incomeUruguayUzbekistanVanuatuVenezuela, RBVietnamWorldYemen, Rep.ZambiaZimbabwe Timeline:
This timeline shows a graph from 1982 to 2015 of St. Lucia. No data until 1981. Number of actual observations by date: 34.
Source name:
World Development Indicators
Source organization:
World Bank staff estimates based data from International Monetary Fund's Direction of Trade database.
Categories, topics:
Private Sector, Trade
Last updated:
apr 23, 2017
Indicators value changes by year
At the date of observation
Value
Absolute change
Change from previous value
jan 1, 1982
100.0
+100.0
0.0%
jan 1, 1983
100.0
0.0
0.0%
jan 1, 1984
100.0
0.0
0.0%
jan 1, 1985
100.0
0.0
0.0%
jan 1, 1986
100.0
0.0
0.0%
jan 1, 1987
100.0
0.0
0.0%
jan 1, 1988
3.442
-96.558
-96.56%
jan 1, 1989
1.63
-1.812
-52.64%
jan 1, 1990
2.354
+0.724
44.4%
jan 1, 1991
1.332
-1.023
-43.43%
jan 1, 1992
1.315
-0.016
-1.23%
jan 1, 1993
2.806
+1.491
113.32%
jan 1, 1994
4.243
+1.437
51.22%
jan 1, 1995
6.292
+2.049
48.29%
jan 1, 1996
7.492
+1.2
19.08%
jan 1, 1997
6.694
-0.798
-10.65%
jan 1, 1998
6.658
-0.036
-0.54%
jan 1, 1999
3.379
-3.279
-49.25%
jan 1, 2000
3.483
+0.104
3.08%
jan 1, 2001
0.167
-3.315
-95.19%
jan 1, 2002
0.092
-0.075
-45.03%
jan 1, 2003
0.057
-0.035
-38.23%
jan 1, 2004
0.115
+0.058
102.34%
jan 1, 2005
0.126
+0.011
9.55%
jan 1, 2006
0.077
-0.049
-39.23%
jan 1, 2007
0.072
-0.005
-6.24%
jan 1, 2008
0.038
-0.034
-46.83%
jan 1, 2009
0.017
-0.022
-56.36%
jan 1, 2010
0.023
+0.007
39.53%
jan 1, 2011
0.022
-0.001
-3.94%
jan 1, 2012
0.024
+0.001
5.93%
jan 1, 2013
0.041
+0.018
75.16%
jan 1, 2014
0.08
+0.038
92.6%
jan 1, 2015
0.04
-0.04
-49.88%
Ranking of countries by current statistics by years


Comments: