29
/
en
AIzaSyAYiBZKx7MnpbEhh9jyipgxe19OcubqV5w
April 1, 2024
281273
Venezuela, RB
VEN
true
2
1
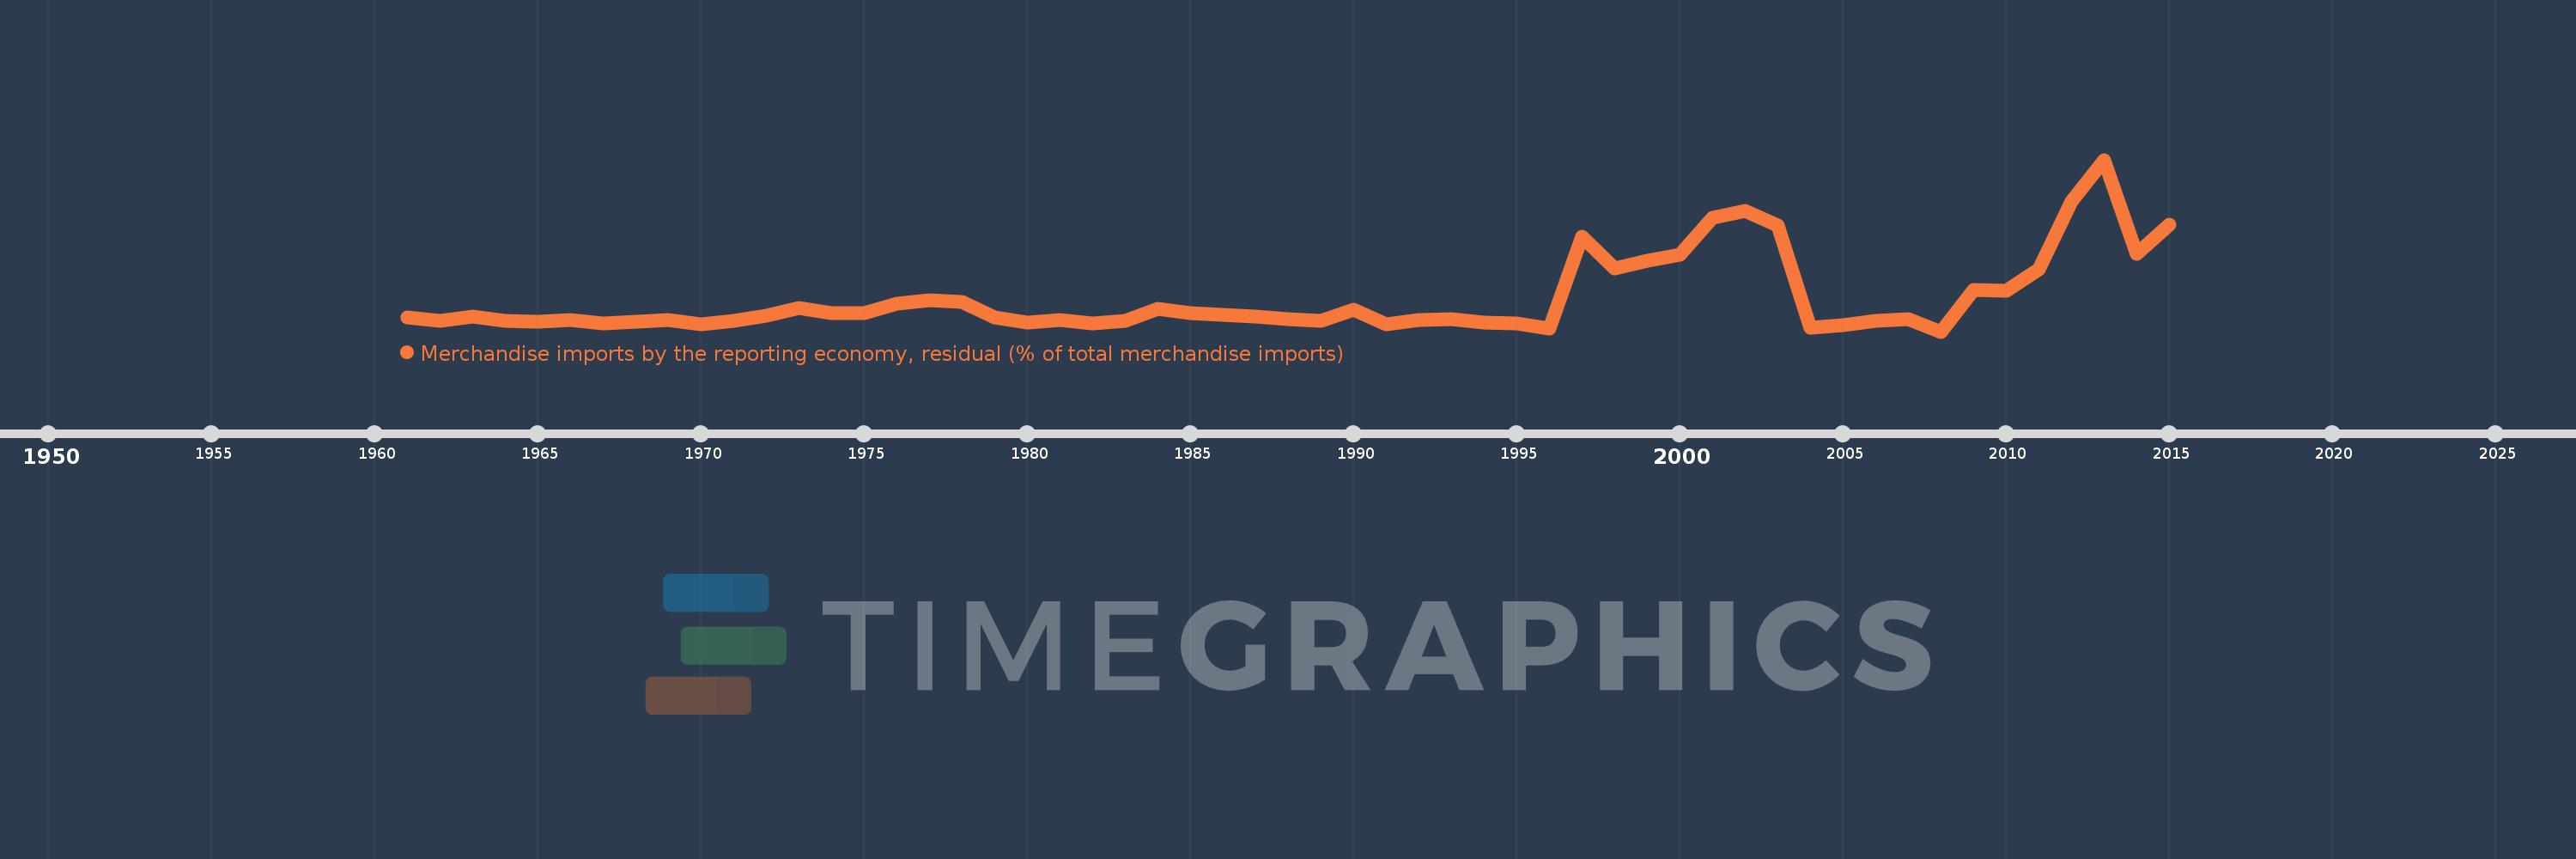
Merchandise imports by the reporting economy, residual (% of total merchandise imports)
2015,2014,2013,2012,2011,2010,2009,2008,2007,2006,2005,2004,2003,2002,2001,2000,1999,1998,1997,1996,1995,1994,1993,1992,1991,1990,1989,1988,1987,1986,1985,1984,1983,1982,1981,1980,1979,1978,1977,1976,1975,1974,1973,1972,1971,1970,1969,1968,1967,1966,1965,1964,1963,1962,1961
This statistics in other country:
AfghanistanAlbaniaAlgeriaAmerican SamoaAngolaAntigua and BarbudaArab WorldArgentinaArmeniaArubaAustraliaAustriaAzerbaijanBahamas, TheBahrainBangladeshBarbadosBelarusBelgiumBelizeBeninBermudaBoliviaBosnia and HerzegovinaBrazilBrunei DarussalamBulgariaBurkina FasoBurundiCabo VerdeCambodiaCameroonCanadaCaribbean small statesCentral African RepublicCentral Europe and the BalticsChadChileChinaColombiaComorosCongo, Dem. Rep.Congo, Rep.Costa RicaCote d'IvoireCroatiaCubaCyprusCzech RepublicDenmarkDjiboutiDominicaDominican RepublicEarly-demographic dividendEast Asia & PacificEast Asia & Pacific (excluding high income)East Asia & Pacific (IDA & IBRD countries)EcuadorEgypt, Arab Rep.El SalvadorEquatorial GuineaEstoniaEthiopiaEuro areaEurope & Central AsiaEurope & Central Asia (excluding high income)Europe & Central Asia (IDA & IBRD countries)European UnionFaroe IslandsFijiFinlandFragile and conflict affected situationsFranceFrench PolynesiaGabonGambia, TheGeorgiaGermanyGhanaGibraltarGreeceGreenlandGrenadaGuamGuatemalaGuineaGuinea-BissauGuyanaHaitiHeavily indebted poor countries (HIPC)High incomeHondurasHong Kong SAR, ChinaHungaryIBRD onlyIcelandIDA & IBRD totalIDA blendIDA onlyIDA totalIndiaIndonesiaIran, Islamic Rep.IraqIrelandIsraelItalyJamaicaJapanJordanKazakhstanKenyaKiribatiKorea, Dem. People’s Rep.Korea, Rep.KosovoKuwaitKyrgyz RepublicLao PDRLate-demographic dividendLatin America & Caribbean Latin America & Caribbean (excluding high income)Latin America & the Caribbean (IDA & IBRD countries)LatviaLeast developed countries: UN classificationLebanonLiberiaLibyaLithuaniaLow & middle incomeLow incomeLower middle incomeLuxembourgMacao SAR, ChinaMacedonia, FYRMadagascarMalawiMalaysiaMaldivesMaliMaltaMauritaniaMauritiusMexicoMiddle East & North AfricaMiddle East & North Africa (excluding high income)Middle East & North Africa (IDA & IBRD countries)Middle incomeMoldovaMongoliaMontenegroMoroccoMozambiqueMyanmarNauruNepalNetherlandsNew CaledoniaNew ZealandNicaraguaNigerNigeriaNorth AmericaNorwayOECD membersOmanOther small statesPacific island small statesPakistanPanamaPapua New GuineaParaguayPeruPhilippinesPolandPortugalPost-demographic dividendPre-demographic dividendQatarRomaniaRussian FederationRwandaSamoaSao Tome and PrincipeSaudi ArabiaSenegalSerbiaSeychellesSierra LeoneSingaporeSlovak RepublicSloveniaSmall statesSolomon IslandsSomaliaSouth AfricaSouth AsiaSouth Asia (IDA & IBRD)SpainSri LankaSt. Kitts and NevisSt. LuciaSt. Vincent and the GrenadinesSub-Saharan Africa Sub-Saharan Africa (excluding high income)Sub-Saharan Africa (IDA & IBRD countries)SudanSurinameSwedenSwitzerlandSyrian Arab RepublicTajikistanTanzaniaThailandTogoTongaTrinidad and TobagoTunisiaTurkeyTurkmenistanTuvaluUgandaUkraineUnited Arab EmiratesUnited KingdomUnited StatesUpper middle incomeUruguayUzbekistanVanuatuVenezuela, RBVietnamWorldYemen, Rep.ZambiaZimbabwe Timeline:
This timeline shows a graph from 1961 to 2015 of Venezuela, RB. No data until 1960. Number of actual observations by date: 55.
Source name:
World Development Indicators
Source organization:
World Bank staff estimates based data from International Monetary Fund's Direction of Trade database.
Categories, topics:
Private Sector, Trade
Last updated:
apr 23, 2017
Indicators value changes by year
Maximum:
28.739
jan 1, 2013
At the date of observation
Value
Absolute change
Change from previous value
jan 1, 1961
3.29
+3.29
0.0%
jan 1, 1962
2.68
-0.61
-18.54%
jan 1, 1963
3.405
+0.726
27.08%
jan 1, 1964
2.701
-0.704
-20.67%
jan 1, 1965
2.661
-0.041
-1.5%
jan 1, 1966
2.856
+0.195
7.34%
jan 1, 1967
2.356
-0.5
-17.51%
jan 1, 1968
2.565
+0.209
8.89%
jan 1, 1969
2.905
+0.34
13.26%
jan 1, 1970
2.238
-0.668
-22.99%
jan 1, 1971
2.692
+0.454
20.29%
jan 1, 1972
3.584
+0.893
33.17%
jan 1, 1973
4.864
+1.279
35.69%
jan 1, 1974
3.94
-0.923
-18.98%
jan 1, 1975
3.943
+0.003
0.07%
jan 1, 1976
5.493
+1.55
39.3%
jan 1, 1977
6.047
+0.554
10.08%
jan 1, 1978
5.79
-0.257
-4.24%
jan 1, 1979
3.337
-2.453
-42.37%
jan 1, 1980
2.491
-0.846
-25.35%
jan 1, 1981
2.933
+0.442
17.74%
jan 1, 1982
2.29
-0.642
-21.91%
jan 1, 1983
2.687
+0.396
17.3%
jan 1, 1984
4.753
+2.066
76.9%
jan 1, 1985
3.953
-0.8
-16.82%
jan 1, 1986
3.765
-0.188
-4.76%
jan 1, 1987
3.379
-0.386
-10.25%
jan 1, 1988
3.088
-0.291
-8.61%
jan 1, 1989
2.773
-0.315
-10.21%
jan 1, 1990
4.548
+1.775
64.03%
jan 1, 1991
2.221
-2.327
-51.17%
jan 1, 1992
2.851
+0.63
28.37%
jan 1, 1993
3.06
+0.209
7.32%
jan 1, 1994
2.426
-0.634
-20.72%
jan 1, 1995
2.262
-0.163
-6.74%
jan 1, 1996
1.51
-0.752
-33.24%
jan 1, 1997
16.294
+14.784
978.87%
jan 1, 1998
11.203
-5.091
-31.25%
jan 1, 1999
12.42
+1.217
10.87%
jan 1, 2000
13.426
+1.006
8.1%
jan 1, 2001
19.424
+5.998
44.68%
jan 1, 2002
20.496
+1.072
5.52%
jan 1, 2003
18.145
-2.351
-11.47%
jan 1, 2004
1.6
-16.545
-91.18%
jan 1, 2005
2.012
+0.412
25.74%
jan 1, 2006
2.709
+0.697
34.65%
jan 1, 2007
3.023
+0.314
11.59%
jan 1, 2008
1.012
-2.011
-66.52%
jan 1, 2009
7.773
+6.761
667.91%
jan 1, 2010
7.537
-0.236
-3.04%
jan 1, 2011
11.121
+3.584
47.55%
jan 1, 2012
22.071
+10.95
98.47%
jan 1, 2013
28.739
+6.668
30.21%
jan 1, 2014
13.518
-15.221
-52.96%
jan 1, 2015
18.303
+4.785
35.4%
Ranking of countries by current statistics by years


Comments: