29
/
en
AIzaSyAYiBZKx7MnpbEhh9jyipgxe19OcubqV5w
April 1, 2024
280044
Vanuatu
VUT
true
2
1
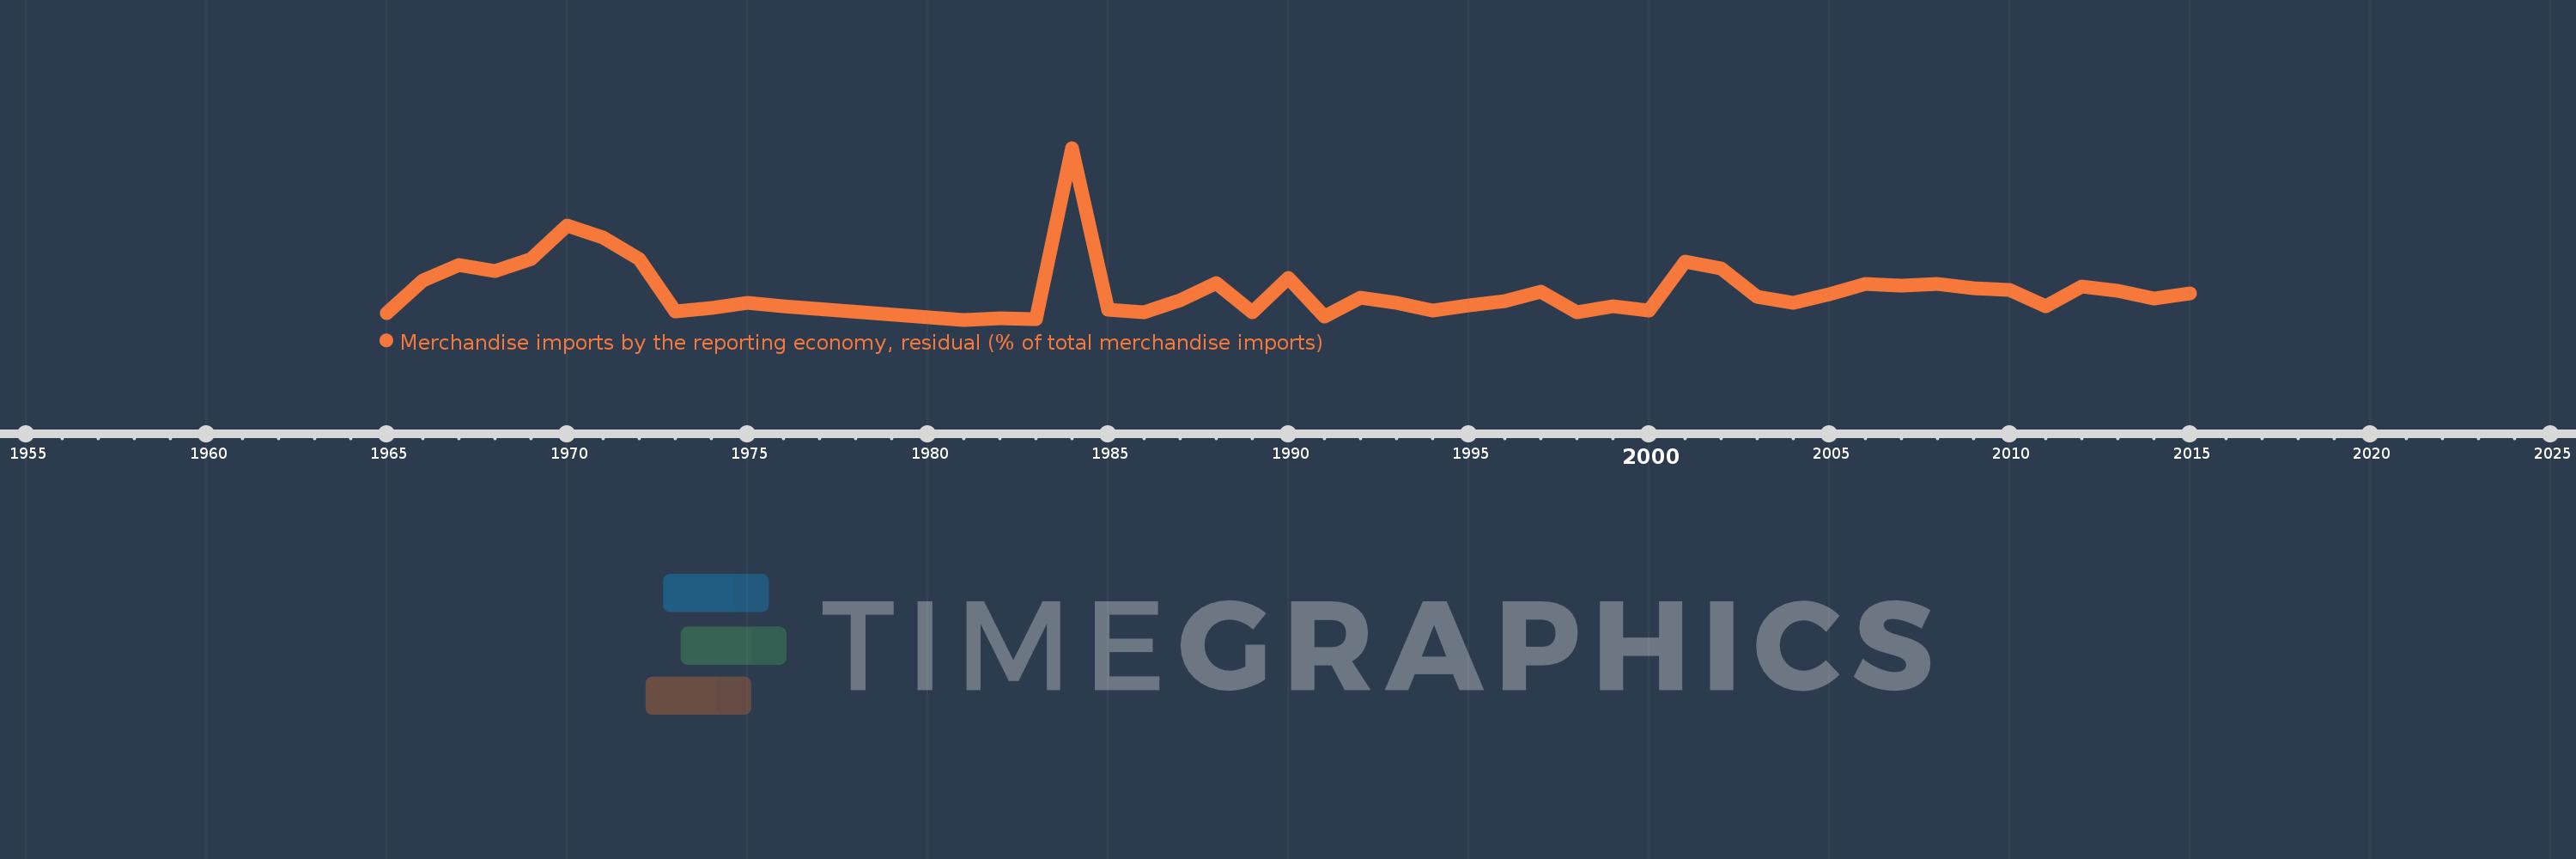
Merchandise imports by the reporting economy, residual (% of total merchandise imports)
2015,2014,2013,2012,2011,2010,2009,2008,2007,2006,2005,2004,2003,2002,2001,2000,1999,1998,1997,1996,1995,1994,1993,1992,1991,1990,1989,1988,1987,1986,1985,1984,1983,1982,1981,1976,1975,1974,1973,1972,1971,1970,1969,1968,1967,1966,1965
This statistics in other country:
AfghanistanAlbaniaAlgeriaAmerican SamoaAngolaAntigua and BarbudaArab WorldArgentinaArmeniaArubaAustraliaAustriaAzerbaijanBahamas, TheBahrainBangladeshBarbadosBelarusBelgiumBelizeBeninBermudaBoliviaBosnia and HerzegovinaBrazilBrunei DarussalamBulgariaBurkina FasoBurundiCabo VerdeCambodiaCameroonCanadaCaribbean small statesCentral African RepublicCentral Europe and the BalticsChadChileChinaColombiaComorosCongo, Dem. Rep.Congo, Rep.Costa RicaCote d'IvoireCroatiaCubaCyprusCzech RepublicDenmarkDjiboutiDominicaDominican RepublicEarly-demographic dividendEast Asia & PacificEast Asia & Pacific (excluding high income)East Asia & Pacific (IDA & IBRD countries)EcuadorEgypt, Arab Rep.El SalvadorEquatorial GuineaEstoniaEthiopiaEuro areaEurope & Central AsiaEurope & Central Asia (excluding high income)Europe & Central Asia (IDA & IBRD countries)European UnionFaroe IslandsFijiFinlandFragile and conflict affected situationsFranceFrench PolynesiaGabonGambia, TheGeorgiaGermanyGhanaGibraltarGreeceGreenlandGrenadaGuamGuatemalaGuineaGuinea-BissauGuyanaHaitiHeavily indebted poor countries (HIPC)High incomeHondurasHong Kong SAR, ChinaHungaryIBRD onlyIcelandIDA & IBRD totalIDA blendIDA onlyIDA totalIndiaIndonesiaIran, Islamic Rep.IraqIrelandIsraelItalyJamaicaJapanJordanKazakhstanKenyaKiribatiKorea, Dem. People’s Rep.Korea, Rep.KosovoKuwaitKyrgyz RepublicLao PDRLate-demographic dividendLatin America & Caribbean Latin America & Caribbean (excluding high income)Latin America & the Caribbean (IDA & IBRD countries)LatviaLeast developed countries: UN classificationLebanonLiberiaLibyaLithuaniaLow & middle incomeLow incomeLower middle incomeLuxembourgMacao SAR, ChinaMacedonia, FYRMadagascarMalawiMalaysiaMaldivesMaliMaltaMauritaniaMauritiusMexicoMiddle East & North AfricaMiddle East & North Africa (excluding high income)Middle East & North Africa (IDA & IBRD countries)Middle incomeMoldovaMongoliaMontenegroMoroccoMozambiqueMyanmarNauruNepalNetherlandsNew CaledoniaNew ZealandNicaraguaNigerNigeriaNorth AmericaNorwayOECD membersOmanOther small statesPacific island small statesPakistanPanamaPapua New GuineaParaguayPeruPhilippinesPolandPortugalPost-demographic dividendPre-demographic dividendQatarRomaniaRussian FederationRwandaSamoaSao Tome and PrincipeSaudi ArabiaSenegalSerbiaSeychellesSierra LeoneSingaporeSlovak RepublicSloveniaSmall statesSolomon IslandsSomaliaSouth AfricaSouth AsiaSouth Asia (IDA & IBRD)SpainSri LankaSt. Kitts and NevisSt. LuciaSt. Vincent and the GrenadinesSub-Saharan Africa Sub-Saharan Africa (excluding high income)Sub-Saharan Africa (IDA & IBRD countries)SudanSurinameSwedenSwitzerlandSyrian Arab RepublicTajikistanTanzaniaThailandTogoTongaTrinidad and TobagoTunisiaTurkeyTurkmenistanTuvaluUgandaUkraineUnited Arab EmiratesUnited KingdomUnited StatesUpper middle incomeUruguayUzbekistanVanuatuVenezuela, RBVietnamWorldYemen, Rep.ZambiaZimbabwe Timeline:
This timeline shows a graph from 1965 to 2015 of Vanuatu. No data until 1964. Number of actual observations by date: 47.
Source name:
World Development Indicators
Source organization:
World Bank staff estimates based data from International Monetary Fund's Direction of Trade database.
Categories, topics:
Private Sector, Trade
Last updated:
apr 23, 2017
Indicators value changes by year
Maximum:
18.675
jan 1, 1984
At the date of observation
Value
Absolute change
Change from previous value
jan 1, 1965
0.904
+0.904
0.0%
jan 1, 1966
4.471
+3.567
394.45%
jan 1, 1967
6.091
+1.62
36.23%
jan 1, 1968
5.449
-0.642
-10.54%
jan 1, 1969
6.751
+1.302
23.9%
jan 1, 1970
10.371
+3.62
53.63%
jan 1, 1971
9.039
-1.332
-12.85%
jan 1, 1972
6.719
-2.32
-25.66%
jan 1, 1973
1.115
-5.604
-83.4%
jan 1, 1974
1.5
+0.384
34.47%
jan 1, 1975
2.07
+0.57
38.02%
jan 1, 1976
1.647
-0.423
-20.45%
jan 1, 1981
0.214
-1.432
-87.0%
jan 1, 1982
0.388
+0.174
81.35%
jan 1, 1983
0.263
-0.125
-32.17%
jan 1, 1984
18.675
+18.412
6.99K%
jan 1, 1985
1.27
-17.405
-93.2%
jan 1, 1986
0.987
-0.283
-22.31%
jan 1, 1987
2.286
+1.3
131.7%
jan 1, 1988
4.121
+1.835
80.25%
jan 1, 1989
1.005
-3.116
-75.62%
jan 1, 1990
4.752
+3.747
372.88%
jan 1, 1991
0.555
-4.197
-88.32%
jan 1, 1992
2.632
+2.077
374.33%
jan 1, 1993
2.003
-0.629
-23.9%
jan 1, 1994
1.217
-0.786
-39.23%
jan 1, 1995
1.732
+0.515
42.28%
jan 1, 1996
2.234
+0.502
28.96%
jan 1, 1997
3.199
+0.965
43.22%
jan 1, 1998
1.063
-2.136
-66.76%
jan 1, 1999
1.672
+0.609
57.27%
jan 1, 2000
1.226
-0.447
-26.71%
jan 1, 2001
6.503
+5.277
430.61%
jan 1, 2002
5.724
-0.779
-11.98%
jan 1, 2003
2.721
-3.003
-52.47%
jan 1, 2004
2.068
-0.653
-24.0%
jan 1, 2005
2.918
+0.85
41.12%
jan 1, 2006
4.088
+1.17
40.09%
jan 1, 2007
3.846
-0.242
-5.92%
jan 1, 2008
4.074
+0.228
5.94%
jan 1, 2009
3.614
-0.461
-11.3%
jan 1, 2010
3.419
-0.195
-5.38%
jan 1, 2011
1.7
-1.719
-50.28%
jan 1, 2012
3.819
+2.119
124.67%
jan 1, 2013
3.34
-0.479
-12.54%
jan 1, 2014
2.484
-0.856
-25.63%
jan 1, 2015
3.039
+0.555
22.33%
Ranking of countries by current statistics by years


Comments: