29
/
en
AIzaSyAYiBZKx7MnpbEhh9jyipgxe19OcubqV5w
April 1, 2024
61827
Upper middle income
UMC
false
2
1
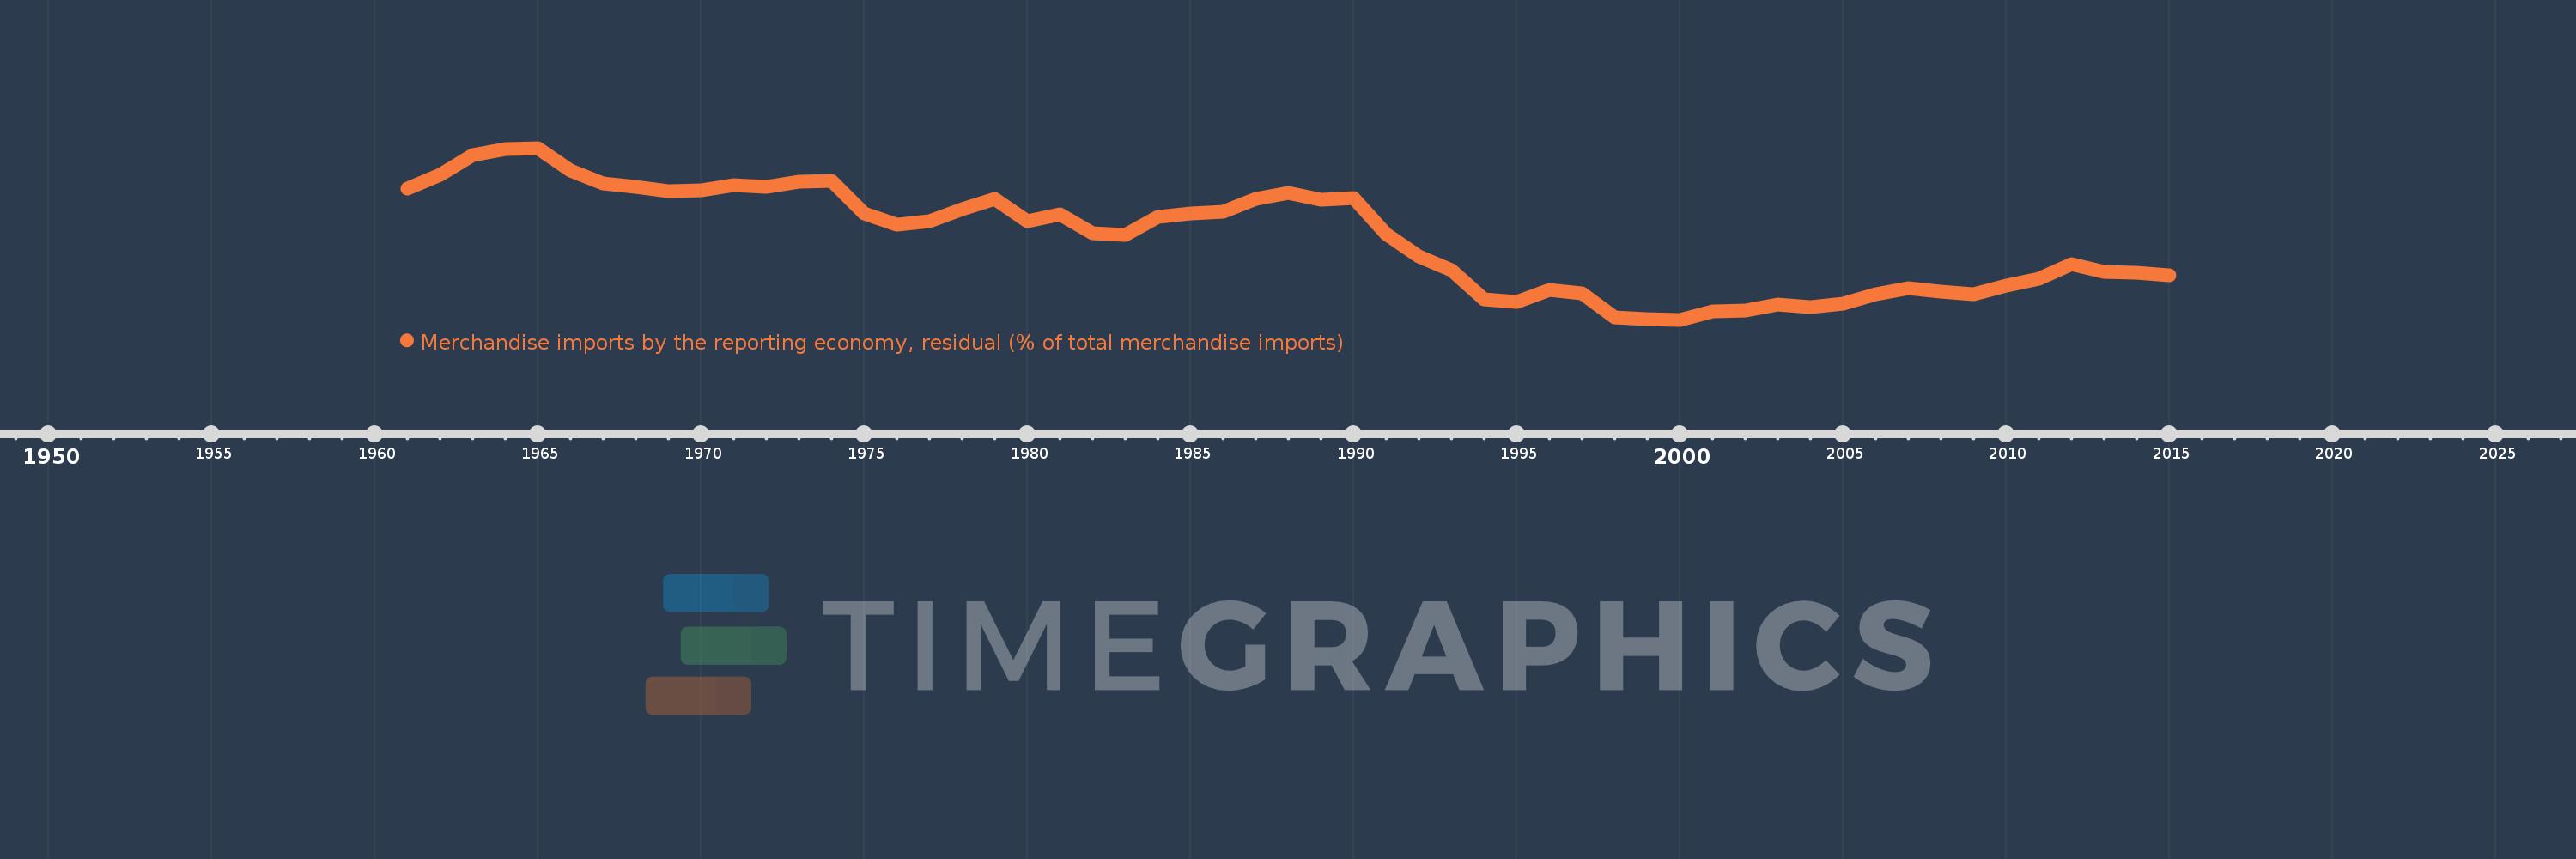
Merchandise imports by the reporting economy, residual (% of total merchandise imports)
2015,2014,2013,2012,2011,2010,2009,2008,2007,2006,2005,2004,2003,2002,2001,2000,1999,1998,1997,1996,1995,1994,1993,1992,1991,1990,1989,1988,1987,1986,1985,1984,1983,1982,1981,1980,1979,1978,1977,1976,1975,1974,1973,1972,1971,1970,1969,1968,1967,1966,1965,1964,1963,1962,1961
This statistics in other country:
AfghanistanAlbaniaAlgeriaAmerican SamoaAngolaAntigua and BarbudaArab WorldArgentinaArmeniaArubaAustraliaAustriaAzerbaijanBahamas, TheBahrainBangladeshBarbadosBelarusBelgiumBelizeBeninBermudaBoliviaBosnia and HerzegovinaBrazilBrunei DarussalamBulgariaBurkina FasoBurundiCabo VerdeCambodiaCameroonCanadaCaribbean small statesCentral African RepublicCentral Europe and the BalticsChadChileChinaColombiaComorosCongo, Dem. Rep.Congo, Rep.Costa RicaCote d'IvoireCroatiaCubaCyprusCzech RepublicDenmarkDjiboutiDominicaDominican RepublicEarly-demographic dividendEast Asia & PacificEast Asia & Pacific (excluding high income)East Asia & Pacific (IDA & IBRD countries)EcuadorEgypt, Arab Rep.El SalvadorEquatorial GuineaEstoniaEthiopiaEuro areaEurope & Central AsiaEurope & Central Asia (excluding high income)Europe & Central Asia (IDA & IBRD countries)European UnionFaroe IslandsFijiFinlandFragile and conflict affected situationsFranceFrench PolynesiaGabonGambia, TheGeorgiaGermanyGhanaGibraltarGreeceGreenlandGrenadaGuamGuatemalaGuineaGuinea-BissauGuyanaHaitiHeavily indebted poor countries (HIPC)High incomeHondurasHong Kong SAR, ChinaHungaryIBRD onlyIcelandIDA & IBRD totalIDA blendIDA onlyIDA totalIndiaIndonesiaIran, Islamic Rep.IraqIrelandIsraelItalyJamaicaJapanJordanKazakhstanKenyaKiribatiKorea, Dem. People’s Rep.Korea, Rep.KosovoKuwaitKyrgyz RepublicLao PDRLate-demographic dividendLatin America & Caribbean Latin America & Caribbean (excluding high income)Latin America & the Caribbean (IDA & IBRD countries)LatviaLeast developed countries: UN classificationLebanonLiberiaLibyaLithuaniaLow & middle incomeLow incomeLower middle incomeLuxembourgMacao SAR, ChinaMacedonia, FYRMadagascarMalawiMalaysiaMaldivesMaliMaltaMauritaniaMauritiusMexicoMiddle East & North AfricaMiddle East & North Africa (excluding high income)Middle East & North Africa (IDA & IBRD countries)Middle incomeMoldovaMongoliaMontenegroMoroccoMozambiqueMyanmarNauruNepalNetherlandsNew CaledoniaNew ZealandNicaraguaNigerNigeriaNorth AmericaNorwayOECD membersOmanOther small statesPacific island small statesPakistanPanamaPapua New GuineaParaguayPeruPhilippinesPolandPortugalPost-demographic dividendPre-demographic dividendQatarRomaniaRussian FederationRwandaSamoaSao Tome and PrincipeSaudi ArabiaSenegalSerbiaSeychellesSierra LeoneSingaporeSlovak RepublicSloveniaSmall statesSolomon IslandsSomaliaSouth AfricaSouth AsiaSouth Asia (IDA & IBRD)SpainSri LankaSt. Kitts and NevisSt. LuciaSt. Vincent and the GrenadinesSub-Saharan Africa Sub-Saharan Africa (excluding high income)Sub-Saharan Africa (IDA & IBRD countries)SudanSurinameSwedenSwitzerlandSyrian Arab RepublicTajikistanTanzaniaThailandTogoTongaTrinidad and TobagoTunisiaTurkeyTurkmenistanTuvaluUgandaUkraineUnited Arab EmiratesUnited KingdomUnited StatesUpper middle incomeUruguayUzbekistanVanuatuVenezuela, RBVietnamWorldYemen, Rep.ZambiaZimbabwe Timeline:
This timeline shows a graph from 1961 to 2015 of Upper middle income. No data until 1960. Number of actual observations by date: 55.
Source name:
World Development Indicators
Source organization:
World Bank staff estimates based data from International Monetary Fund's Direction of Trade database.
Categories, topics:
Private Sector, Trade
Last updated:
apr 23, 2017
Indicators value changes by year
Maximum:
11.791
jan 1, 1965
At the date of observation
Value
Absolute change
Change from previous value
jan 1, 1961
9.555
+9.555
0.0%
jan 1, 1962
10.304
+0.749
7.84%
jan 1, 1963
11.423
+1.119
10.86%
jan 1, 1964
11.753
+0.33
2.89%
jan 1, 1965
11.791
+0.038
0.32%
jan 1, 1966
10.553
-1.238
-10.5%
jan 1, 1967
9.86
-0.692
-6.56%
jan 1, 1968
9.679
-0.181
-1.84%
jan 1, 1969
9.421
-0.258
-2.67%
jan 1, 1970
9.49
+0.069
0.73%
jan 1, 1971
9.748
+0.258
2.72%
jan 1, 1972
9.649
-0.099
-1.01%
jan 1, 1973
9.949
+0.3
3.11%
jan 1, 1974
10.0
+0.051
0.51%
jan 1, 1975
8.208
-1.792
-17.92%
jan 1, 1976
7.579
-0.628
-7.66%
jan 1, 1977
7.759
+0.18
2.38%
jan 1, 1978
8.436
+0.676
8.72%
jan 1, 1979
8.984
+0.549
6.5%
jan 1, 1980
7.793
-1.192
-13.27%
jan 1, 1981
8.134
+0.341
4.38%
jan 1, 1982
7.122
-1.012
-12.44%
jan 1, 1983
7.008
-0.114
-1.6%
jan 1, 1984
7.998
+0.99
14.13%
jan 1, 1985
8.185
+0.187
2.34%
jan 1, 1986
8.308
+0.123
1.51%
jan 1, 1987
9.02
+0.712
8.57%
jan 1, 1988
9.34
+0.32
3.55%
jan 1, 1989
8.968
-0.372
-3.98%
jan 1, 1990
9.066
+0.097
1.09%
jan 1, 1991
7.068
-1.998
-22.04%
jan 1, 1992
5.851
-1.216
-17.21%
jan 1, 1993
5.079
-0.772
-13.2%
jan 1, 1994
3.492
-1.586
-31.24%
jan 1, 1995
3.358
-0.135
-3.85%
jan 1, 1996
4.021
+0.663
19.74%
jan 1, 1997
3.826
-0.195
-4.85%
jan 1, 1998
2.482
-1.344
-35.13%
jan 1, 1999
2.431
-0.051
-2.06%
jan 1, 2000
2.377
-0.054
-2.22%
jan 1, 2001
2.812
+0.435
18.31%
jan 1, 2002
2.858
+0.046
1.64%
jan 1, 2003
3.213
+0.355
12.42%
jan 1, 2004
3.048
-0.164
-5.12%
jan 1, 2005
3.277
+0.229
7.5%
jan 1, 2006
3.781
+0.504
15.39%
jan 1, 2007
4.102
+0.32
8.48%
jan 1, 2008
3.903
-0.199
-4.85%
jan 1, 2009
3.782
-0.121
-3.09%
jan 1, 2010
4.254
+0.472
12.48%
jan 1, 2011
4.632
+0.378
8.88%
jan 1, 2012
5.44
+0.808
17.44%
jan 1, 2013
4.995
-0.444
-8.17%
jan 1, 2014
4.929
-0.066
-1.32%
jan 1, 2015
4.819
-0.11
-2.23%
Ranking of countries by current statistics by years


Comments: