29
/
en
AIzaSyAYiBZKx7MnpbEhh9jyipgxe19OcubqV5w
April 1, 2024
240690
Singapore
SGP
true
2
1
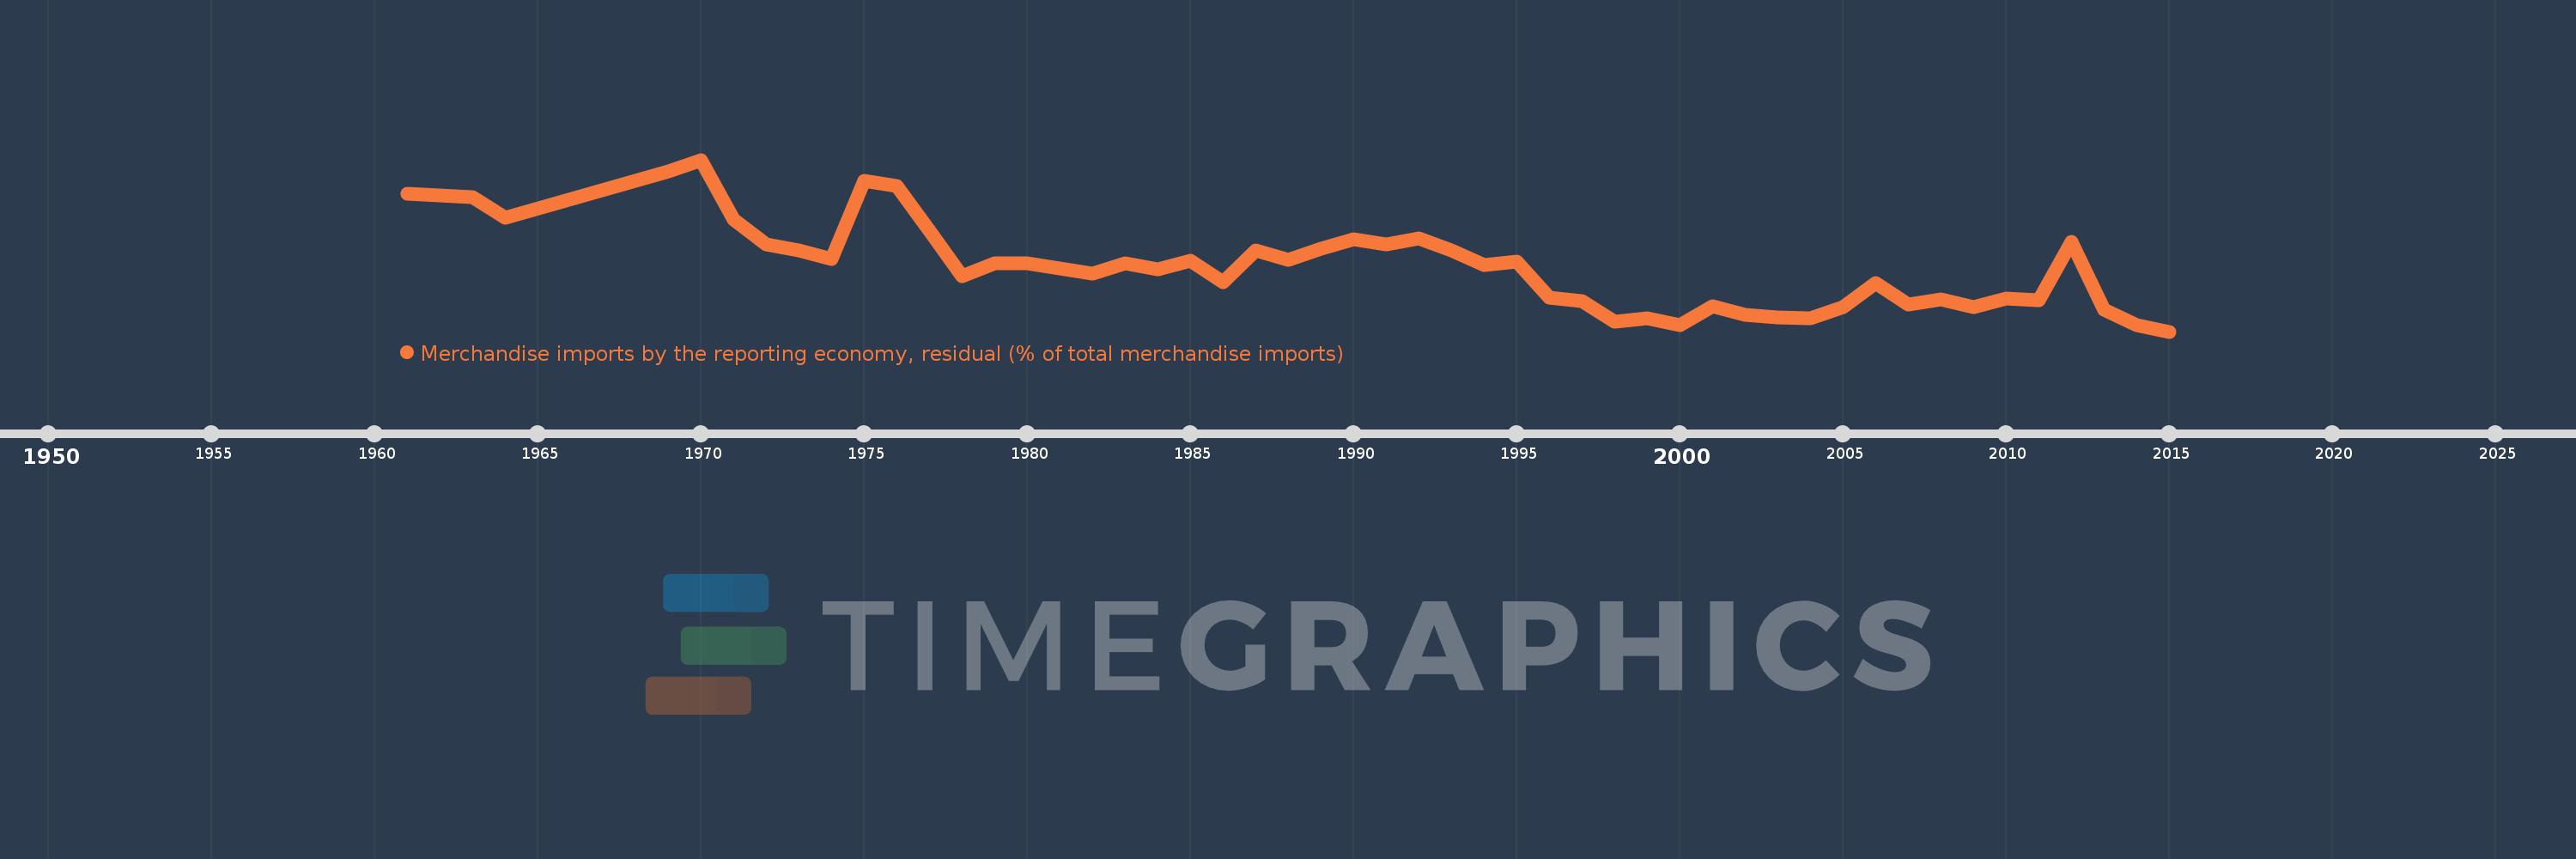
Merchandise imports by the reporting economy, residual (% of total merchandise imports)
2015,2014,2013,2012,2011,2010,2009,2008,2007,2006,2005,2004,2003,2002,2001,2000,1999,1998,1997,1996,1995,1994,1993,1992,1991,1990,1989,1988,1987,1986,1985,1984,1983,1982,1981,1980,1979,1978,1977,1976,1975,1974,1973,1972,1971,1970,1969,1964,1963,1961
This statistics in other country:
AfghanistanAlbaniaAlgeriaAmerican SamoaAngolaAntigua and BarbudaArab WorldArgentinaArmeniaArubaAustraliaAustriaAzerbaijanBahamas, TheBahrainBangladeshBarbadosBelarusBelgiumBelizeBeninBermudaBoliviaBosnia and HerzegovinaBrazilBrunei DarussalamBulgariaBurkina FasoBurundiCabo VerdeCambodiaCameroonCanadaCaribbean small statesCentral African RepublicCentral Europe and the BalticsChadChileChinaColombiaComorosCongo, Dem. Rep.Congo, Rep.Costa RicaCote d'IvoireCroatiaCubaCyprusCzech RepublicDenmarkDjiboutiDominicaDominican RepublicEarly-demographic dividendEast Asia & PacificEast Asia & Pacific (excluding high income)East Asia & Pacific (IDA & IBRD countries)EcuadorEgypt, Arab Rep.El SalvadorEquatorial GuineaEstoniaEthiopiaEuro areaEurope & Central AsiaEurope & Central Asia (excluding high income)Europe & Central Asia (IDA & IBRD countries)European UnionFaroe IslandsFijiFinlandFragile and conflict affected situationsFranceFrench PolynesiaGabonGambia, TheGeorgiaGermanyGhanaGibraltarGreeceGreenlandGrenadaGuamGuatemalaGuineaGuinea-BissauGuyanaHaitiHeavily indebted poor countries (HIPC)High incomeHondurasHong Kong SAR, ChinaHungaryIBRD onlyIcelandIDA & IBRD totalIDA blendIDA onlyIDA totalIndiaIndonesiaIran, Islamic Rep.IraqIrelandIsraelItalyJamaicaJapanJordanKazakhstanKenyaKiribatiKorea, Dem. People’s Rep.Korea, Rep.KosovoKuwaitKyrgyz RepublicLao PDRLate-demographic dividendLatin America & Caribbean Latin America & Caribbean (excluding high income)Latin America & the Caribbean (IDA & IBRD countries)LatviaLeast developed countries: UN classificationLebanonLiberiaLibyaLithuaniaLow & middle incomeLow incomeLower middle incomeLuxembourgMacao SAR, ChinaMacedonia, FYRMadagascarMalawiMalaysiaMaldivesMaliMaltaMauritaniaMauritiusMexicoMiddle East & North AfricaMiddle East & North Africa (excluding high income)Middle East & North Africa (IDA & IBRD countries)Middle incomeMoldovaMongoliaMontenegroMoroccoMozambiqueMyanmarNauruNepalNetherlandsNew CaledoniaNew ZealandNicaraguaNigerNigeriaNorth AmericaNorwayOECD membersOmanOther small statesPacific island small statesPakistanPanamaPapua New GuineaParaguayPeruPhilippinesPolandPortugalPost-demographic dividendPre-demographic dividendQatarRomaniaRussian FederationRwandaSamoaSao Tome and PrincipeSaudi ArabiaSenegalSerbiaSeychellesSierra LeoneSingaporeSlovak RepublicSloveniaSmall statesSolomon IslandsSomaliaSouth AfricaSouth AsiaSouth Asia (IDA & IBRD)SpainSri LankaSt. Kitts and NevisSt. LuciaSt. Vincent and the GrenadinesSub-Saharan Africa Sub-Saharan Africa (excluding high income)Sub-Saharan Africa (IDA & IBRD countries)SudanSurinameSwedenSwitzerlandSyrian Arab RepublicTajikistanTanzaniaThailandTogoTongaTrinidad and TobagoTunisiaTurkeyTurkmenistanTuvaluUgandaUkraineUnited Arab EmiratesUnited KingdomUnited StatesUpper middle incomeUruguayUzbekistanVanuatuVenezuela, RBVietnamWorldYemen, Rep.ZambiaZimbabwe Timeline:
This timeline shows a graph from 1961 to 2015 of Singapore. No data until 1960. Number of actual observations by date: 50.
Source name:
World Development Indicators
Source organization:
World Bank staff estimates based data from International Monetary Fund's Direction of Trade database.
Categories, topics:
Private Sector, Trade
Last updated:
apr 23, 2017
Indicators value changes by year
At the date of observation
Value
Absolute change
Change from previous value
jan 1, 1961
2.55
+2.55
0.0%
jan 1, 1963
2.483
-0.066
-2.59%
jan 1, 1964
2.106
-0.378
-15.22%
jan 1, 1969
2.952
+0.847
40.22%
jan 1, 1970
3.162
+0.209
7.09%
jan 1, 1971
2.068
-1.094
-34.6%
jan 1, 1972
1.618
-0.45
-21.77%
jan 1, 1973
1.513
-0.105
-6.49%
jan 1, 1974
1.353
-0.16
-10.57%
jan 1, 1975
2.781
+1.428
105.6%
jan 1, 1976
2.681
-0.101
-3.61%
jan 1, 1977
1.876
-0.805
-30.02%
jan 1, 1978
1.039
-0.837
-44.6%
jan 1, 1979
1.278
+0.238
22.94%
jan 1, 1980
1.277
-0.001
-0.06%
jan 1, 1981
1.183
-0.094
-7.39%
jan 1, 1982
1.084
-0.099
-8.35%
jan 1, 1983
1.267
+0.183
16.87%
jan 1, 1984
1.157
-0.11
-8.65%
jan 1, 1985
1.313
+0.156
13.48%
jan 1, 1986
0.935
-0.379
-28.84%
jan 1, 1987
1.502
+0.568
60.76%
jan 1, 1988
1.331
-0.171
-11.38%
jan 1, 1989
1.542
+0.211
15.85%
jan 1, 1990
1.71
+0.168
10.89%
jan 1, 1991
1.618
-0.093
-5.41%
jan 1, 1992
1.733
+0.115
7.12%
jan 1, 1993
1.504
-0.228
-13.18%
jan 1, 1994
1.237
-0.268
-17.81%
jan 1, 1995
1.31
+0.073
5.91%
jan 1, 1996
0.638
-0.671
-51.27%
jan 1, 1997
0.586
-0.052
-8.17%
jan 1, 1998
0.212
-0.374
-63.84%
jan 1, 1999
0.265
+0.053
25.21%
jan 1, 2000
0.141
-0.124
-46.68%
jan 1, 2001
0.487
+0.346
244.58%
jan 1, 2002
0.335
-0.152
-31.2%
jan 1, 2003
0.28
-0.055
-16.39%
jan 1, 2004
0.271
-0.009
-3.3%
jan 1, 2005
0.471
+0.199
73.56%
jan 1, 2006
0.909
+0.439
93.23%
jan 1, 2007
0.521
-0.389
-42.75%
jan 1, 2008
0.615
+0.094
18.11%
jan 1, 2009
0.479
-0.136
-22.13%
jan 1, 2010
0.634
+0.155
32.34%
jan 1, 2011
0.596
-0.038
-5.92%
jan 1, 2012
1.67
+1.073
180.03%
jan 1, 2013
0.431
-1.239
-74.21%
jan 1, 2014
0.141
-0.29
-67.34%
jan 1, 2015
0.026
-0.115
-81.49%
Ranking of countries by current statistics by years


Comments: