29
/
en
AIzaSyAYiBZKx7MnpbEhh9jyipgxe19OcubqV5w
April 1, 2024
149384
Haiti
HTI
true
2
1
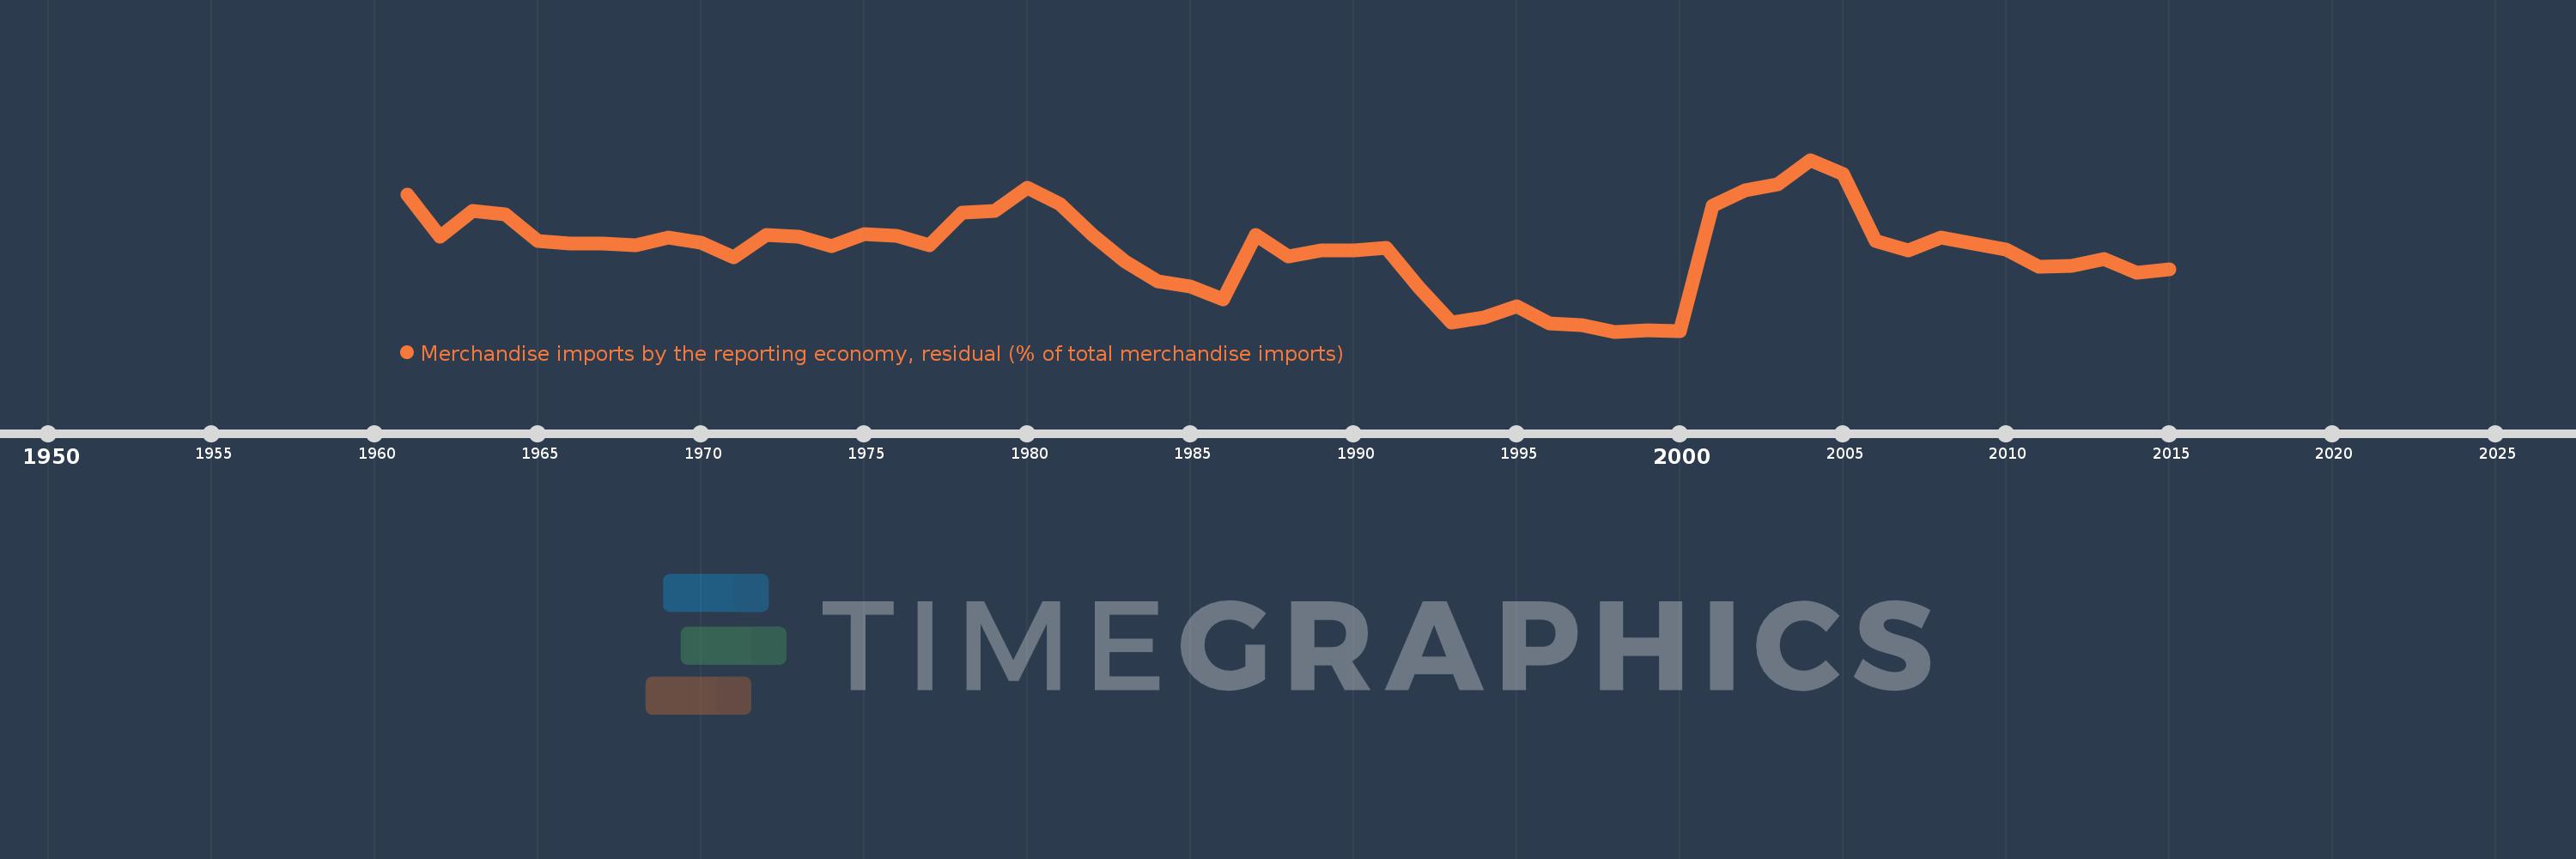
Merchandise imports by the reporting economy, residual (% of total merchandise imports)
2015,2014,2013,2012,2011,2010,2009,2008,2007,2006,2005,2004,2003,2002,2001,2000,1999,1998,1997,1996,1995,1994,1993,1992,1991,1990,1989,1988,1987,1986,1985,1984,1983,1982,1981,1980,1979,1978,1977,1976,1975,1974,1973,1972,1971,1970,1969,1968,1967,1966,1965,1964,1963,1962,1961
This statistics in other country:
AfghanistanAlbaniaAlgeriaAmerican SamoaAngolaAntigua and BarbudaArab WorldArgentinaArmeniaArubaAustraliaAustriaAzerbaijanBahamas, TheBahrainBangladeshBarbadosBelarusBelgiumBelizeBeninBermudaBoliviaBosnia and HerzegovinaBrazilBrunei DarussalamBulgariaBurkina FasoBurundiCabo VerdeCambodiaCameroonCanadaCaribbean small statesCentral African RepublicCentral Europe and the BalticsChadChileChinaColombiaComorosCongo, Dem. Rep.Congo, Rep.Costa RicaCote d'IvoireCroatiaCubaCyprusCzech RepublicDenmarkDjiboutiDominicaDominican RepublicEarly-demographic dividendEast Asia & PacificEast Asia & Pacific (excluding high income)East Asia & Pacific (IDA & IBRD countries)EcuadorEgypt, Arab Rep.El SalvadorEquatorial GuineaEstoniaEthiopiaEuro areaEurope & Central AsiaEurope & Central Asia (excluding high income)Europe & Central Asia (IDA & IBRD countries)European UnionFaroe IslandsFijiFinlandFragile and conflict affected situationsFranceFrench PolynesiaGabonGambia, TheGeorgiaGermanyGhanaGibraltarGreeceGreenlandGrenadaGuamGuatemalaGuineaGuinea-BissauGuyanaHaitiHeavily indebted poor countries (HIPC)High incomeHondurasHong Kong SAR, ChinaHungaryIBRD onlyIcelandIDA & IBRD totalIDA blendIDA onlyIDA totalIndiaIndonesiaIran, Islamic Rep.IraqIrelandIsraelItalyJamaicaJapanJordanKazakhstanKenyaKiribatiKorea, Dem. People’s Rep.Korea, Rep.KosovoKuwaitKyrgyz RepublicLao PDRLate-demographic dividendLatin America & Caribbean Latin America & Caribbean (excluding high income)Latin America & the Caribbean (IDA & IBRD countries)LatviaLeast developed countries: UN classificationLebanonLiberiaLibyaLithuaniaLow & middle incomeLow incomeLower middle incomeLuxembourgMacao SAR, ChinaMacedonia, FYRMadagascarMalawiMalaysiaMaldivesMaliMaltaMauritaniaMauritiusMexicoMiddle East & North AfricaMiddle East & North Africa (excluding high income)Middle East & North Africa (IDA & IBRD countries)Middle incomeMoldovaMongoliaMontenegroMoroccoMozambiqueMyanmarNauruNepalNetherlandsNew CaledoniaNew ZealandNicaraguaNigerNigeriaNorth AmericaNorwayOECD membersOmanOther small statesPacific island small statesPakistanPanamaPapua New GuineaParaguayPeruPhilippinesPolandPortugalPost-demographic dividendPre-demographic dividendQatarRomaniaRussian FederationRwandaSamoaSao Tome and PrincipeSaudi ArabiaSenegalSerbiaSeychellesSierra LeoneSingaporeSlovak RepublicSloveniaSmall statesSolomon IslandsSomaliaSouth AfricaSouth AsiaSouth Asia (IDA & IBRD)SpainSri LankaSt. Kitts and NevisSt. LuciaSt. Vincent and the GrenadinesSub-Saharan Africa Sub-Saharan Africa (excluding high income)Sub-Saharan Africa (IDA & IBRD countries)SudanSurinameSwedenSwitzerlandSyrian Arab RepublicTajikistanTanzaniaThailandTogoTongaTrinidad and TobagoTunisiaTurkeyTurkmenistanTuvaluUgandaUkraineUnited Arab EmiratesUnited KingdomUnited StatesUpper middle incomeUruguayUzbekistanVanuatuVenezuela, RBVietnamWorldYemen, Rep.ZambiaZimbabwe Timeline:
This timeline shows a graph from 1961 to 2015 of Haiti. No data until 1960. Number of actual observations by date: 55.
Source name:
World Development Indicators
Source organization:
World Bank staff estimates based data from International Monetary Fund's Direction of Trade database.
Categories, topics:
Private Sector, Trade
Last updated:
apr 23, 2017
Indicators value changes by year
Maximum:
19.455
jan 1, 2004
At the date of observation
Value
Absolute change
Change from previous value
jan 1, 1961
15.836
+15.836
0.0%
jan 1, 1962
11.392
-4.444
-28.06%
jan 1, 1963
14.065
+2.673
23.47%
jan 1, 1964
13.725
-0.339
-2.41%
jan 1, 1965
10.924
-2.801
-20.41%
jan 1, 1966
10.644
-0.28
-2.56%
jan 1, 1967
10.596
-0.048
-0.45%
jan 1, 1968
10.419
-0.177
-1.67%
jan 1, 1969
11.239
+0.82
7.87%
jan 1, 1970
10.713
-0.526
-4.68%
jan 1, 1971
9.201
-1.512
-14.12%
jan 1, 1972
11.512
+2.311
25.12%
jan 1, 1973
11.351
-0.16
-1.39%
jan 1, 1974
10.333
-1.019
-8.97%
jan 1, 1975
11.65
+1.317
12.75%
jan 1, 1976
11.429
-0.221
-1.9%
jan 1, 1977
10.492
-0.937
-8.2%
jan 1, 1978
13.887
+3.395
32.36%
jan 1, 1979
14.032
+0.146
1.05%
jan 1, 1980
16.477
+2.444
17.42%
jan 1, 1981
14.798
-1.678
-10.19%
jan 1, 1982
11.501
-3.297
-22.28%
jan 1, 1983
8.77
-2.731
-23.75%
jan 1, 1984
6.7
-2.07
-23.6%
jan 1, 1985
6.078
-0.622
-9.28%
jan 1, 1986
4.745
-1.334
-21.94%
jan 1, 1987
11.501
+6.757
142.4%
jan 1, 1988
9.313
-2.188
-19.03%
jan 1, 1989
9.947
+0.634
6.81%
jan 1, 1990
9.947
0.0
0.0%
jan 1, 1991
10.23
+0.283
2.84%
jan 1, 1992
6.004
-4.226
-41.31%
jan 1, 1993
2.285
-3.718
-61.93%
jan 1, 1994
2.823
+0.538
23.53%
jan 1, 1995
4.038
+1.215
43.04%
jan 1, 1996
2.263
-1.776
-43.97%
jan 1, 1997
2.036
-0.226
-10.01%
jan 1, 1998
1.373
-0.663
-32.56%
jan 1, 1999
1.472
+0.099
7.19%
jan 1, 2000
1.408
-0.064
-4.34%
jan 1, 2001
14.66
+13.252
941.14%
jan 1, 2002
16.268
+1.608
10.97%
jan 1, 2003
16.921
+0.653
4.01%
jan 1, 2004
19.455
+2.534
14.98%
jan 1, 2005
17.995
-1.46
-7.51%
jan 1, 2006
10.928
-7.067
-39.27%
jan 1, 2007
9.96
-0.968
-8.86%
jan 1, 2008
11.311
+1.35
13.56%
jan 1, 2009
10.599
-0.711
-6.29%
jan 1, 2010
10.008
-0.591
-5.57%
jan 1, 2011
8.165
-1.843
-18.41%
jan 1, 2012
8.332
+0.166
2.03%
jan 1, 2013
9.049
+0.717
8.61%
jan 1, 2014
7.546
-1.503
-16.61%
jan 1, 2015
7.903
+0.357
4.73%
Ranking of countries by current statistics by years


Comments: