29
/
en
AIzaSyAYiBZKx7MnpbEhh9jyipgxe19OcubqV5w
April 1, 2024
132257
Fiji
FJI
true
2
1
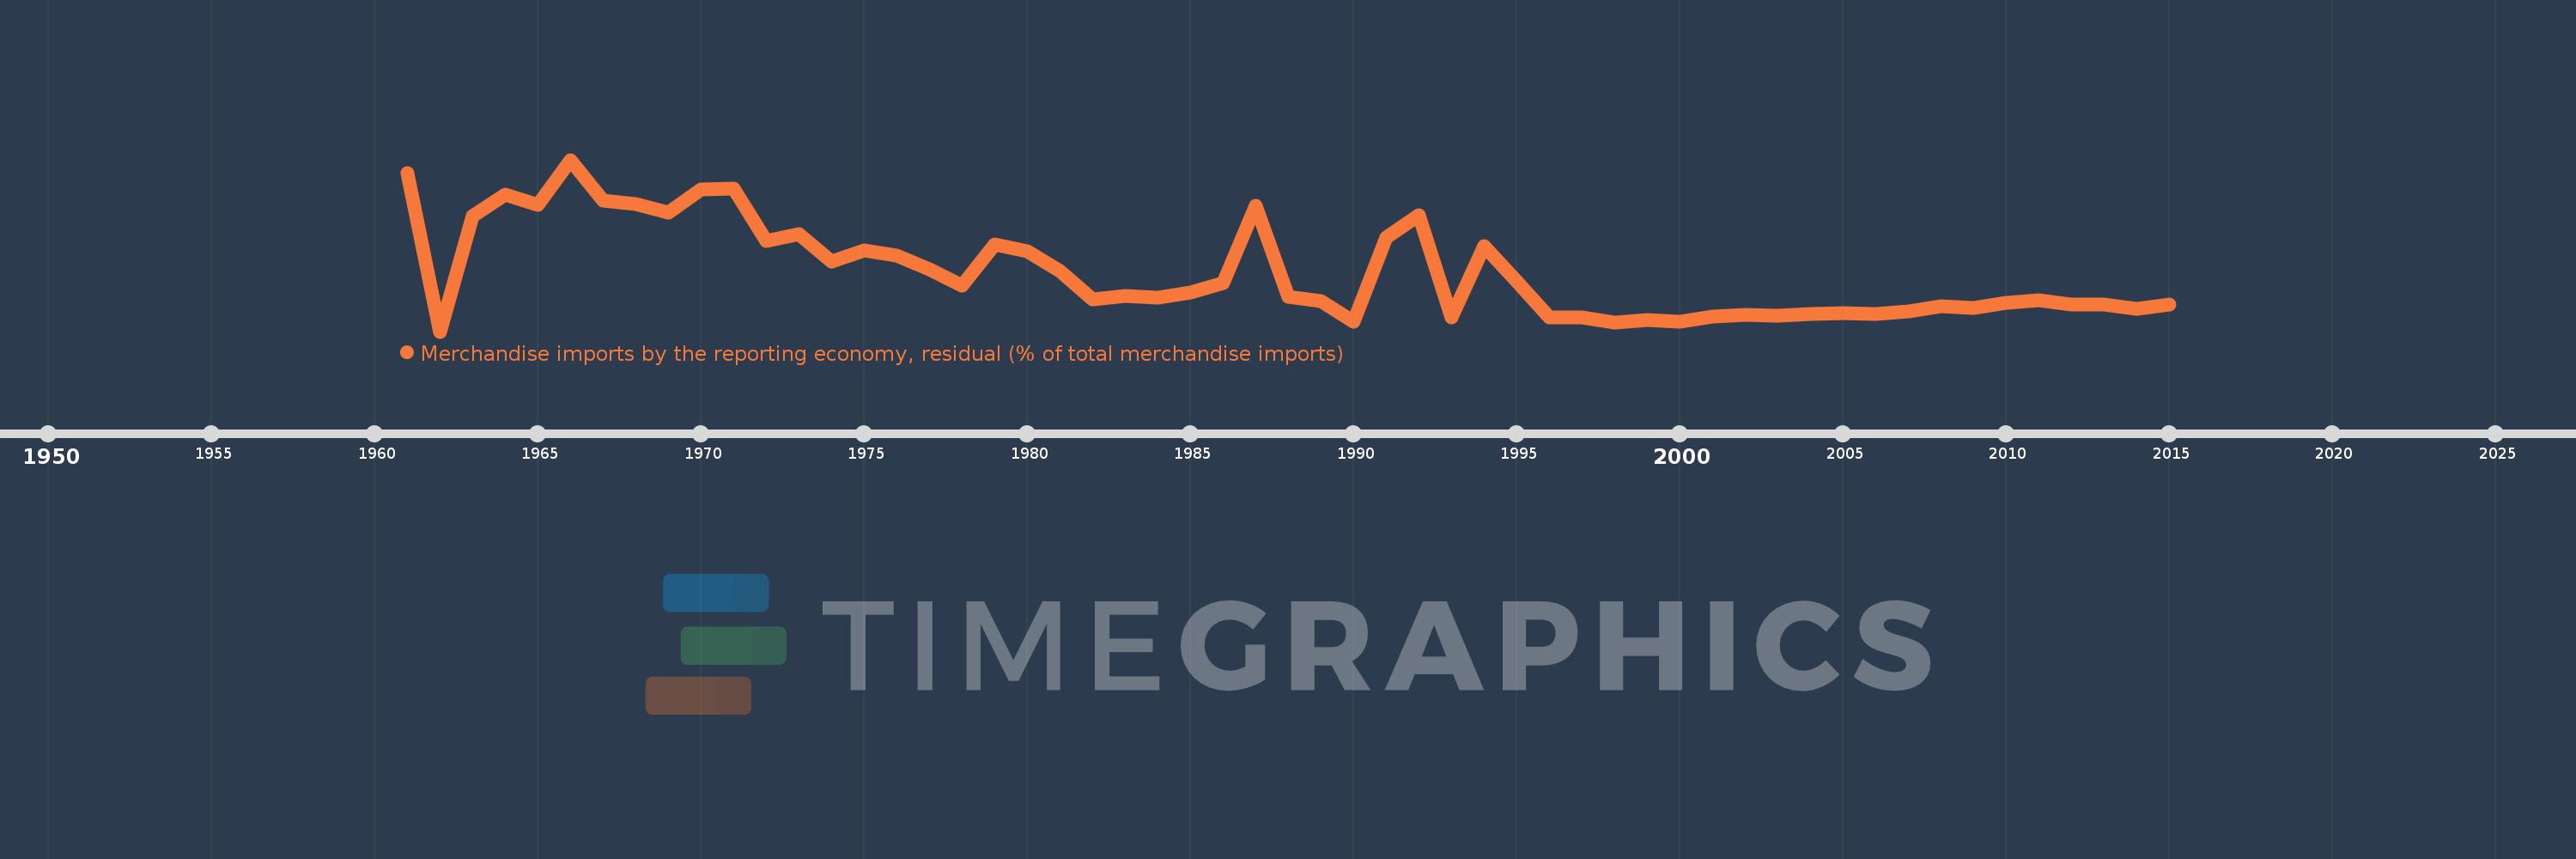
Merchandise imports by the reporting economy, residual (% of total merchandise imports)
2015,2014,2013,2012,2011,2010,2009,2008,2007,2006,2005,2004,2003,2002,2001,2000,1999,1998,1997,1996,1995,1994,1993,1992,1991,1990,1989,1988,1987,1986,1985,1984,1983,1982,1981,1980,1979,1978,1977,1976,1975,1974,1973,1972,1971,1970,1969,1968,1967,1966,1965,1964,1963,1962,1961
This statistics in other country:
AfghanistanAlbaniaAlgeriaAmerican SamoaAngolaAntigua and BarbudaArab WorldArgentinaArmeniaArubaAustraliaAustriaAzerbaijanBahamas, TheBahrainBangladeshBarbadosBelarusBelgiumBelizeBeninBermudaBoliviaBosnia and HerzegovinaBrazilBrunei DarussalamBulgariaBurkina FasoBurundiCabo VerdeCambodiaCameroonCanadaCaribbean small statesCentral African RepublicCentral Europe and the BalticsChadChileChinaColombiaComorosCongo, Dem. Rep.Congo, Rep.Costa RicaCote d'IvoireCroatiaCubaCyprusCzech RepublicDenmarkDjiboutiDominicaDominican RepublicEarly-demographic dividendEast Asia & PacificEast Asia & Pacific (excluding high income)East Asia & Pacific (IDA & IBRD countries)EcuadorEgypt, Arab Rep.El SalvadorEquatorial GuineaEstoniaEthiopiaEuro areaEurope & Central AsiaEurope & Central Asia (excluding high income)Europe & Central Asia (IDA & IBRD countries)European UnionFaroe IslandsFijiFinlandFragile and conflict affected situationsFranceFrench PolynesiaGabonGambia, TheGeorgiaGermanyGhanaGibraltarGreeceGreenlandGrenadaGuamGuatemalaGuineaGuinea-BissauGuyanaHaitiHeavily indebted poor countries (HIPC)High incomeHondurasHong Kong SAR, ChinaHungaryIBRD onlyIcelandIDA & IBRD totalIDA blendIDA onlyIDA totalIndiaIndonesiaIran, Islamic Rep.IraqIrelandIsraelItalyJamaicaJapanJordanKazakhstanKenyaKiribatiKorea, Dem. People’s Rep.Korea, Rep.KosovoKuwaitKyrgyz RepublicLao PDRLate-demographic dividendLatin America & Caribbean Latin America & Caribbean (excluding high income)Latin America & the Caribbean (IDA & IBRD countries)LatviaLeast developed countries: UN classificationLebanonLiberiaLibyaLithuaniaLow & middle incomeLow incomeLower middle incomeLuxembourgMacao SAR, ChinaMacedonia, FYRMadagascarMalawiMalaysiaMaldivesMaliMaltaMauritaniaMauritiusMexicoMiddle East & North AfricaMiddle East & North Africa (excluding high income)Middle East & North Africa (IDA & IBRD countries)Middle incomeMoldovaMongoliaMontenegroMoroccoMozambiqueMyanmarNauruNepalNetherlandsNew CaledoniaNew ZealandNicaraguaNigerNigeriaNorth AmericaNorwayOECD membersOmanOther small statesPacific island small statesPakistanPanamaPapua New GuineaParaguayPeruPhilippinesPolandPortugalPost-demographic dividendPre-demographic dividendQatarRomaniaRussian FederationRwandaSamoaSao Tome and PrincipeSaudi ArabiaSenegalSerbiaSeychellesSierra LeoneSingaporeSlovak RepublicSloveniaSmall statesSolomon IslandsSomaliaSouth AfricaSouth AsiaSouth Asia (IDA & IBRD)SpainSri LankaSt. Kitts and NevisSt. LuciaSt. Vincent and the GrenadinesSub-Saharan Africa Sub-Saharan Africa (excluding high income)Sub-Saharan Africa (IDA & IBRD countries)SudanSurinameSwedenSwitzerlandSyrian Arab RepublicTajikistanTanzaniaThailandTogoTongaTrinidad and TobagoTunisiaTurkeyTurkmenistanTuvaluUgandaUkraineUnited Arab EmiratesUnited KingdomUnited StatesUpper middle incomeUruguayUzbekistanVanuatuVenezuela, RBVietnamWorldYemen, Rep.ZambiaZimbabwe Timeline:
This timeline shows a graph from 1961 to 2015 of Fiji. No data until 1960. Number of actual observations by date: 55.
Source name:
World Development Indicators
Source organization:
World Bank staff estimates based data from International Monetary Fund's Direction of Trade database.
Categories, topics:
Private Sector, Trade
Last updated:
apr 23, 2017
Indicators value changes by year
Maximum:
11.329
jan 1, 1966
At the date of observation
Value
Absolute change
Change from previous value
jan 1, 1961
10.437
+10.437
0.0%
jan 1, 1962
0.0
-10.437
-100.0%
jan 1, 1963
7.621
+7.621
%
jan 1, 1964
9.055
+1.434
18.81%
jan 1, 1965
8.37
-0.685
-7.57%
jan 1, 1966
11.329
+2.959
35.35%
jan 1, 1967
8.661
-2.667
-23.54%
jan 1, 1968
8.43
-0.231
-2.67%
jan 1, 1969
7.87
-0.56
-6.65%
jan 1, 1970
9.379
+1.51
19.18%
jan 1, 1971
9.454
+0.074
0.79%
jan 1, 1972
5.955
-3.499
-37.01%
jan 1, 1973
6.439
+0.484
8.14%
jan 1, 1974
4.639
-1.801
-27.96%
jan 1, 1975
5.375
+0.737
15.88%
jan 1, 1976
5.007
-0.368
-6.86%
jan 1, 1977
4.106
-0.901
-17.99%
jan 1, 1978
3.047
-1.059
-25.79%
jan 1, 1979
5.751
+2.704
88.73%
jan 1, 1980
5.284
-0.467
-8.11%
jan 1, 1981
4.008
-1.276
-24.15%
jan 1, 1982
2.121
-1.887
-47.07%
jan 1, 1983
2.337
+0.215
10.16%
jan 1, 1984
2.217
-0.12
-5.12%
jan 1, 1985
2.586
+0.369
16.62%
jan 1, 1986
3.216
+0.63
24.35%
jan 1, 1987
8.315
+5.1
158.6%
jan 1, 1988
2.284
-6.031
-72.53%
jan 1, 1989
1.999
-0.285
-12.47%
jan 1, 1990
0.629
-1.371
-68.56%
jan 1, 1991
6.221
+5.593
889.76%
jan 1, 1992
7.664
+1.443
23.19%
jan 1, 1993
0.927
-6.737
-87.9%
jan 1, 1994
5.655
+4.728
509.91%
jan 1, 1995
3.325
-2.33
-41.2%
jan 1, 1996
0.934
-2.391
-71.92%
jan 1, 1997
0.954
+0.021
2.21%
jan 1, 1998
0.569
-0.386
-40.4%
jan 1, 1999
0.781
+0.212
37.27%
jan 1, 2000
0.667
-0.114
-14.56%
jan 1, 2001
0.995
+0.328
49.1%
jan 1, 2002
1.096
+0.101
10.2%
jan 1, 2003
1.074
-0.022
-1.98%
jan 1, 2004
1.155
+0.08
7.47%
jan 1, 2005
1.223
+0.069
5.96%
jan 1, 2006
1.186
-0.037
-3.05%
jan 1, 2007
1.334
+0.148
12.49%
jan 1, 2008
1.678
+0.344
25.78%
jan 1, 2009
1.585
-0.093
-5.55%
jan 1, 2010
1.904
+0.319
20.15%
jan 1, 2011
2.046
+0.142
7.44%
jan 1, 2012
1.772
-0.274
-13.37%
jan 1, 2013
1.773
+0.0
0.0%
jan 1, 2014
1.528
-0.244
-13.79%
jan 1, 2015
1.778
+0.25
16.35%
Ranking of countries by current statistics by years


Comments: