29
/
en
AIzaSyAYiBZKx7MnpbEhh9jyipgxe19OcubqV5w
April 1, 2024
131544
Faroe Islands
FRO
true
2
1
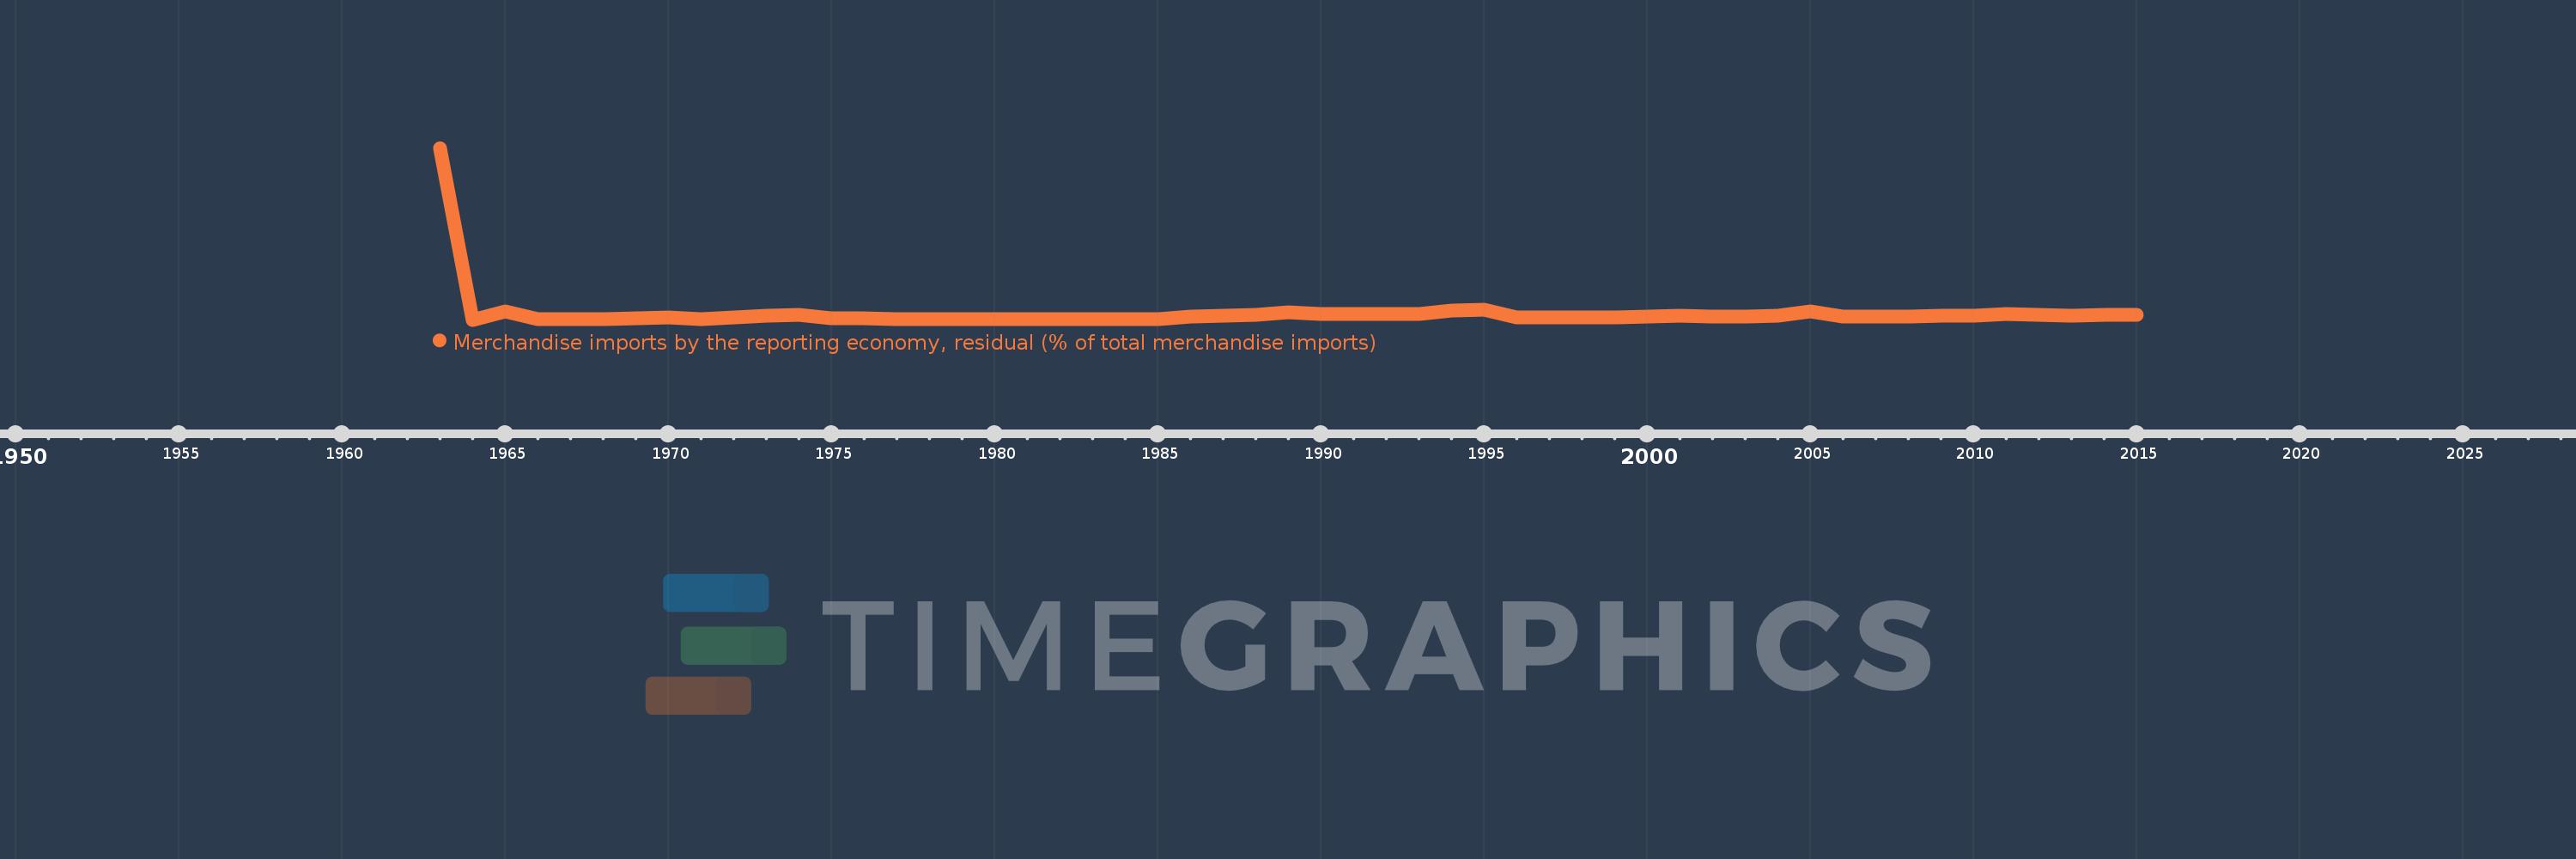
Merchandise imports by the reporting economy, residual (% of total merchandise imports)
2015,2014,2013,2012,2011,2010,2009,2008,2007,2006,2005,2004,2003,2002,2001,2000,1999,1998,1997,1996,1995,1994,1993,1992,1991,1990,1989,1988,1987,1986,1985,1984,1983,1982,1981,1980,1979,1978,1977,1976,1975,1974,1973,1972,1971,1970,1969,1968,1967,1966,1965,1964,1963
This statistics in other country:
AfghanistanAlbaniaAlgeriaAmerican SamoaAngolaAntigua and BarbudaArab WorldArgentinaArmeniaArubaAustraliaAustriaAzerbaijanBahamas, TheBahrainBangladeshBarbadosBelarusBelgiumBelizeBeninBermudaBoliviaBosnia and HerzegovinaBrazilBrunei DarussalamBulgariaBurkina FasoBurundiCabo VerdeCambodiaCameroonCanadaCaribbean small statesCentral African RepublicCentral Europe and the BalticsChadChileChinaColombiaComorosCongo, Dem. Rep.Congo, Rep.Costa RicaCote d'IvoireCroatiaCubaCyprusCzech RepublicDenmarkDjiboutiDominicaDominican RepublicEarly-demographic dividendEast Asia & PacificEast Asia & Pacific (excluding high income)East Asia & Pacific (IDA & IBRD countries)EcuadorEgypt, Arab Rep.El SalvadorEquatorial GuineaEstoniaEthiopiaEuro areaEurope & Central AsiaEurope & Central Asia (excluding high income)Europe & Central Asia (IDA & IBRD countries)European UnionFaroe IslandsFijiFinlandFragile and conflict affected situationsFranceFrench PolynesiaGabonGambia, TheGeorgiaGermanyGhanaGibraltarGreeceGreenlandGrenadaGuamGuatemalaGuineaGuinea-BissauGuyanaHaitiHeavily indebted poor countries (HIPC)High incomeHondurasHong Kong SAR, ChinaHungaryIBRD onlyIcelandIDA & IBRD totalIDA blendIDA onlyIDA totalIndiaIndonesiaIran, Islamic Rep.IraqIrelandIsraelItalyJamaicaJapanJordanKazakhstanKenyaKiribatiKorea, Dem. People’s Rep.Korea, Rep.KosovoKuwaitKyrgyz RepublicLao PDRLate-demographic dividendLatin America & Caribbean Latin America & Caribbean (excluding high income)Latin America & the Caribbean (IDA & IBRD countries)LatviaLeast developed countries: UN classificationLebanonLiberiaLibyaLithuaniaLow & middle incomeLow incomeLower middle incomeLuxembourgMacao SAR, ChinaMacedonia, FYRMadagascarMalawiMalaysiaMaldivesMaliMaltaMauritaniaMauritiusMexicoMiddle East & North AfricaMiddle East & North Africa (excluding high income)Middle East & North Africa (IDA & IBRD countries)Middle incomeMoldovaMongoliaMontenegroMoroccoMozambiqueMyanmarNauruNepalNetherlandsNew CaledoniaNew ZealandNicaraguaNigerNigeriaNorth AmericaNorwayOECD membersOmanOther small statesPacific island small statesPakistanPanamaPapua New GuineaParaguayPeruPhilippinesPolandPortugalPost-demographic dividendPre-demographic dividendQatarRomaniaRussian FederationRwandaSamoaSao Tome and PrincipeSaudi ArabiaSenegalSerbiaSeychellesSierra LeoneSingaporeSlovak RepublicSloveniaSmall statesSolomon IslandsSomaliaSouth AfricaSouth AsiaSouth Asia (IDA & IBRD)SpainSri LankaSt. Kitts and NevisSt. LuciaSt. Vincent and the GrenadinesSub-Saharan Africa Sub-Saharan Africa (excluding high income)Sub-Saharan Africa (IDA & IBRD countries)SudanSurinameSwedenSwitzerlandSyrian Arab RepublicTajikistanTanzaniaThailandTogoTongaTrinidad and TobagoTunisiaTurkeyTurkmenistanTuvaluUgandaUkraineUnited Arab EmiratesUnited KingdomUnited StatesUpper middle incomeUruguayUzbekistanVanuatuVenezuela, RBVietnamWorldYemen, Rep.ZambiaZimbabwe Timeline:
This timeline shows a graph from 1963 to 2015 of Faroe Islands. No data until 1962. Number of actual observations by date: 53.
Source name:
World Development Indicators
Source organization:
World Bank staff estimates based data from International Monetary Fund's Direction of Trade database.
Categories, topics:
Private Sector, Trade
Last updated:
apr 23, 2017
Indicators value changes by year
At the date of observation
Value
Absolute change
Change from previous value
jan 1, 1963
100.0
+100.0
0.0%
jan 1, 1964
0.0
-100.0
-100.0%
jan 1, 1965
4.762
+4.762
%
jan 1, 1966
0.382
-4.38
-91.98%
jan 1, 1967
0.355
-0.027
-7.09%
jan 1, 1968
0.376
+0.021
6.02%
jan 1, 1969
0.679
+0.303
80.62%
jan 1, 1970
1.228
+0.549
80.89%
jan 1, 1971
0.443
-0.785
-63.9%
jan 1, 1972
1.408
+0.964
217.41%
jan 1, 1973
2.301
+0.894
63.51%
jan 1, 1974
2.72
+0.419
18.19%
jan 1, 1975
0.671
-2.049
-75.33%
jan 1, 1976
0.905
+0.234
34.87%
jan 1, 1977
0.276
-0.629
-69.54%
jan 1, 1978
0.303
+0.027
9.75%
jan 1, 1979
0.453
+0.15
49.65%
jan 1, 1980
0.305
-0.148
-32.61%
jan 1, 1981
0.205
-0.1
-32.91%
jan 1, 1982
0.177
-0.028
-13.71%
jan 1, 1983
0.107
-0.069
-39.24%
jan 1, 1984
0.155
+0.047
44.01%
jan 1, 1985
0.346
+0.191
123.83%
jan 1, 1986
2.053
+1.708
493.63%
jan 1, 1987
2.205
+0.151
7.37%
jan 1, 1988
2.795
+0.59
26.77%
jan 1, 1989
4.297
+1.502
53.75%
jan 1, 1990
3.213
-1.084
-25.22%
jan 1, 1991
3.116
-0.097
-3.03%
jan 1, 1992
3.508
+0.392
12.58%
jan 1, 1993
3.314
-0.194
-5.52%
jan 1, 1994
5.206
+1.891
57.07%
jan 1, 1995
5.821
+0.616
11.83%
jan 1, 1996
1.577
-4.245
-72.92%
jan 1, 1997
1.36
-0.216
-13.73%
jan 1, 1998
1.542
+0.182
13.36%
jan 1, 1999
1.166
-0.376
-24.36%
jan 1, 2000
1.965
+0.799
68.54%
jan 1, 2001
2.284
+0.319
16.22%
jan 1, 2002
1.838
-0.446
-19.54%
jan 1, 2003
1.903
+0.066
3.57%
jan 1, 2004
2.106
+0.203
10.65%
jan 1, 2005
4.851
+2.745
130.34%
jan 1, 2006
1.734
-3.117
-64.26%
jan 1, 2007
1.93
+0.196
11.32%
jan 1, 2008
1.913
-0.018
-0.91%
jan 1, 2009
2.153
+0.241
12.59%
jan 1, 2010
2.467
+0.314
14.56%
jan 1, 2011
3.276
+0.809
32.8%
jan 1, 2012
2.91
-0.366
-11.18%
jan 1, 2013
2.581
-0.329
-11.3%
jan 1, 2014
2.972
+0.391
15.15%
jan 1, 2015
2.951
-0.021
-0.7%
Ranking of countries by current statistics by years


Comments: