29
/
en
AIzaSyAYiBZKx7MnpbEhh9jyipgxe19OcubqV5w
April 1, 2024
145938
Guinea
GIN
true
2
1
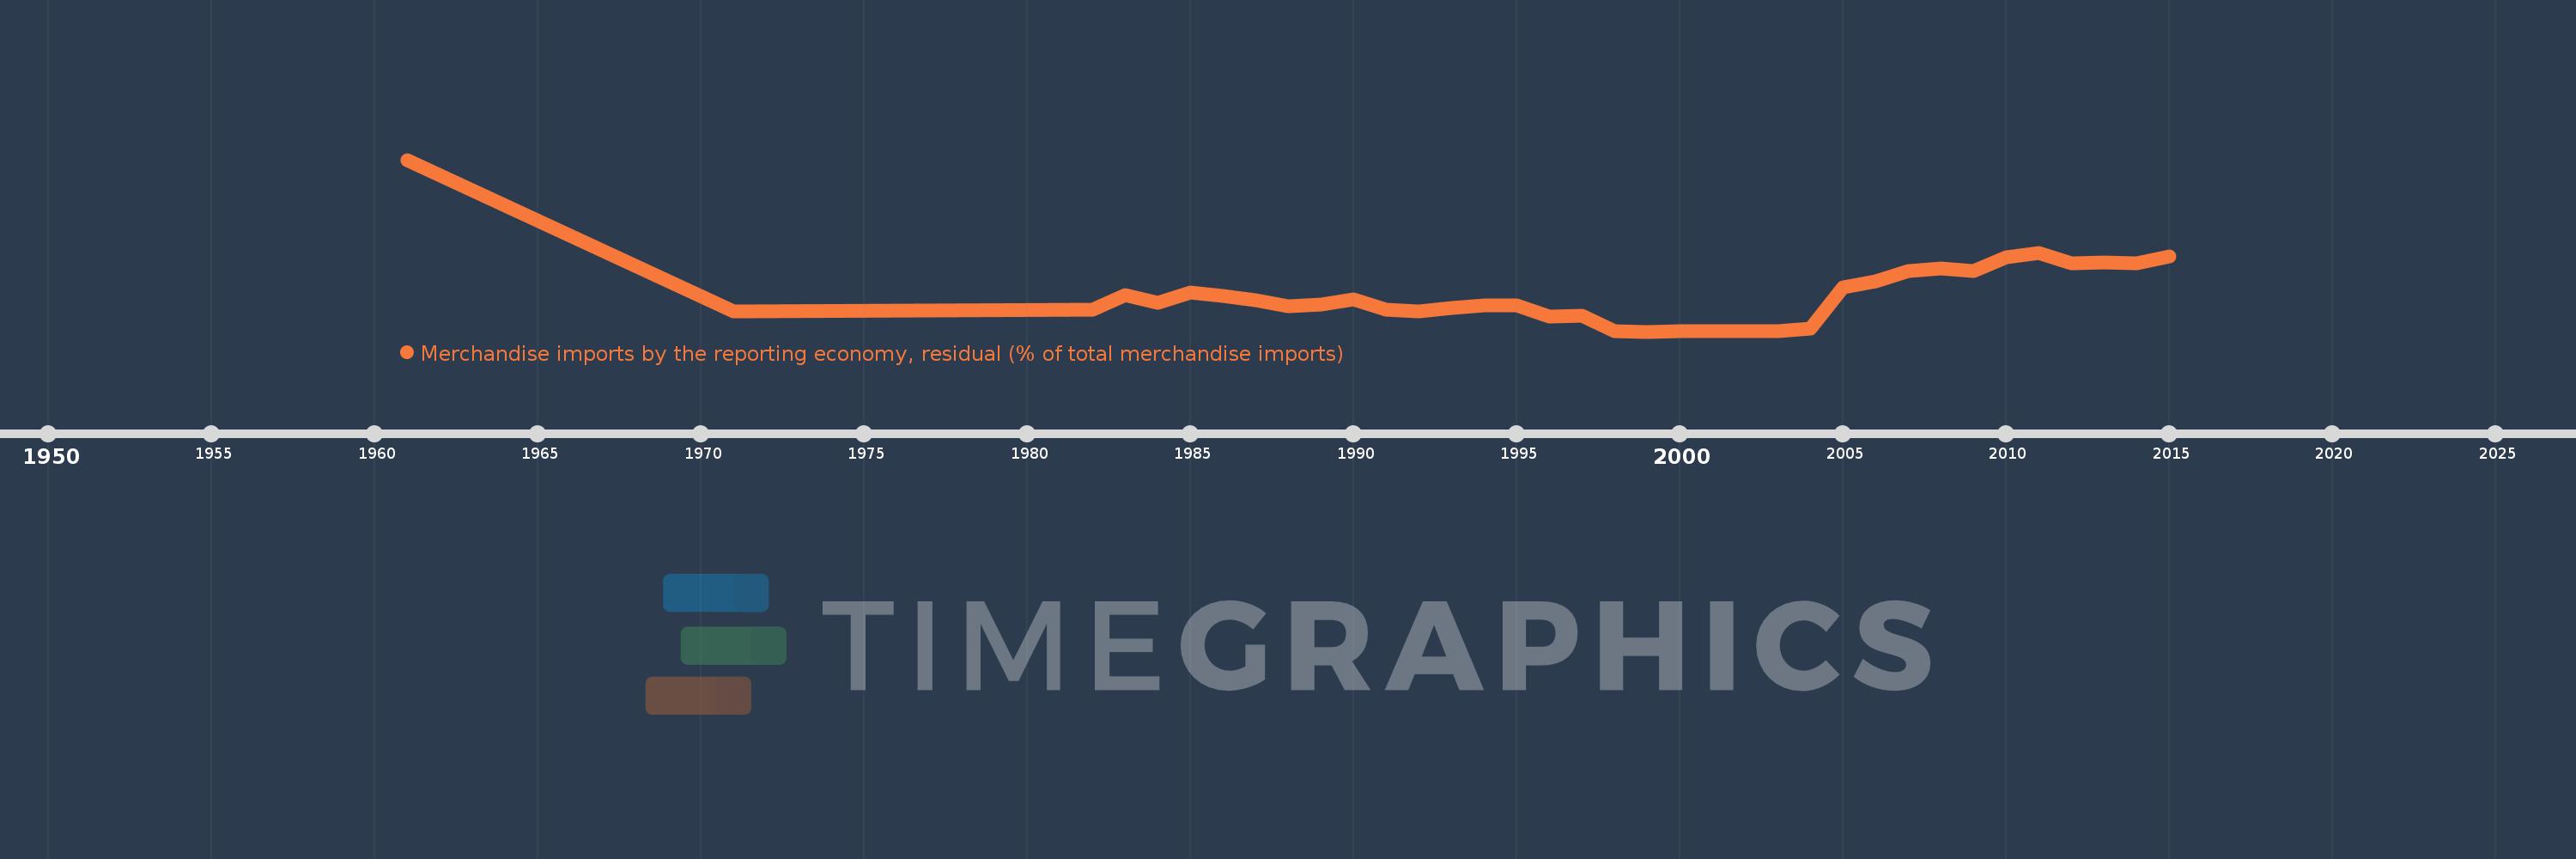
Merchandise imports by the reporting economy, residual (% of total merchandise imports)
2015,2014,2013,2012,2011,2010,2009,2008,2007,2006,2005,2004,2003,2002,2001,2000,1999,1998,1997,1996,1995,1994,1993,1992,1991,1990,1989,1988,1987,1986,1985,1984,1983,1982,1971,1961
This statistics in other country:
AfghanistanAlbaniaAlgeriaAmerican SamoaAngolaAntigua and BarbudaArab WorldArgentinaArmeniaArubaAustraliaAustriaAzerbaijanBahamas, TheBahrainBangladeshBarbadosBelarusBelgiumBelizeBeninBermudaBoliviaBosnia and HerzegovinaBrazilBrunei DarussalamBulgariaBurkina FasoBurundiCabo VerdeCambodiaCameroonCanadaCaribbean small statesCentral African RepublicCentral Europe and the BalticsChadChileChinaColombiaComorosCongo, Dem. Rep.Congo, Rep.Costa RicaCote d'IvoireCroatiaCubaCyprusCzech RepublicDenmarkDjiboutiDominicaDominican RepublicEarly-demographic dividendEast Asia & PacificEast Asia & Pacific (excluding high income)East Asia & Pacific (IDA & IBRD countries)EcuadorEgypt, Arab Rep.El SalvadorEquatorial GuineaEstoniaEthiopiaEuro areaEurope & Central AsiaEurope & Central Asia (excluding high income)Europe & Central Asia (IDA & IBRD countries)European UnionFaroe IslandsFijiFinlandFragile and conflict affected situationsFranceFrench PolynesiaGabonGambia, TheGeorgiaGermanyGhanaGibraltarGreeceGreenlandGrenadaGuamGuatemalaGuineaGuinea-BissauGuyanaHaitiHeavily indebted poor countries (HIPC)High incomeHondurasHong Kong SAR, ChinaHungaryIBRD onlyIcelandIDA & IBRD totalIDA blendIDA onlyIDA totalIndiaIndonesiaIran, Islamic Rep.IraqIrelandIsraelItalyJamaicaJapanJordanKazakhstanKenyaKiribatiKorea, Dem. People’s Rep.Korea, Rep.KosovoKuwaitKyrgyz RepublicLao PDRLate-demographic dividendLatin America & Caribbean Latin America & Caribbean (excluding high income)Latin America & the Caribbean (IDA & IBRD countries)LatviaLeast developed countries: UN classificationLebanonLiberiaLibyaLithuaniaLow & middle incomeLow incomeLower middle incomeLuxembourgMacao SAR, ChinaMacedonia, FYRMadagascarMalawiMalaysiaMaldivesMaliMaltaMauritaniaMauritiusMexicoMiddle East & North AfricaMiddle East & North Africa (excluding high income)Middle East & North Africa (IDA & IBRD countries)Middle incomeMoldovaMongoliaMontenegroMoroccoMozambiqueMyanmarNauruNepalNetherlandsNew CaledoniaNew ZealandNicaraguaNigerNigeriaNorth AmericaNorwayOECD membersOmanOther small statesPacific island small statesPakistanPanamaPapua New GuineaParaguayPeruPhilippinesPolandPortugalPost-demographic dividendPre-demographic dividendQatarRomaniaRussian FederationRwandaSamoaSao Tome and PrincipeSaudi ArabiaSenegalSerbiaSeychellesSierra LeoneSingaporeSlovak RepublicSloveniaSmall statesSolomon IslandsSomaliaSouth AfricaSouth AsiaSouth Asia (IDA & IBRD)SpainSri LankaSt. Kitts and NevisSt. LuciaSt. Vincent and the GrenadinesSub-Saharan Africa Sub-Saharan Africa (excluding high income)Sub-Saharan Africa (IDA & IBRD countries)SudanSurinameSwedenSwitzerlandSyrian Arab RepublicTajikistanTanzaniaThailandTogoTongaTrinidad and TobagoTunisiaTurkeyTurkmenistanTuvaluUgandaUkraineUnited Arab EmiratesUnited KingdomUnited StatesUpper middle incomeUruguayUzbekistanVanuatuVenezuela, RBVietnamWorldYemen, Rep.ZambiaZimbabwe Timeline:
This timeline shows a graph from 1961 to 2015 of Guinea. No data until 1960. Number of actual observations by date: 36.
Source name:
World Development Indicators
Source organization:
World Bank staff estimates based data from International Monetary Fund's Direction of Trade database.
Categories, topics:
Private Sector, Trade
Last updated:
apr 23, 2017
Indicators value changes by year
At the date of observation
Value
Absolute change
Change from previous value
jan 1, 1961
100.0
+100.0
0.0%
jan 1, 1971
11.97
-88.03
-88.03%
jan 1, 1982
12.987
+1.017
8.5%
jan 1, 1983
21.538
+8.551
65.85%
jan 1, 1984
16.992
-4.546
-21.11%
jan 1, 1985
23.061
+6.069
35.72%
jan 1, 1986
20.617
-2.444
-10.6%
jan 1, 1987
18.337
-2.28
-11.06%
jan 1, 1988
14.868
-3.469
-18.92%
jan 1, 1989
15.823
+0.955
6.42%
jan 1, 1990
18.588
+2.765
17.47%
jan 1, 1991
12.846
-5.742
-30.89%
jan 1, 1992
11.671
-1.175
-9.15%
jan 1, 1993
13.652
+1.982
16.98%
jan 1, 1994
15.336
+1.684
12.33%
jan 1, 1995
15.203
-0.133
-0.87%
jan 1, 1996
8.989
-6.214
-40.87%
jan 1, 1997
9.25
+0.261
2.91%
jan 1, 1998
0.112
-9.139
-98.79%
jan 1, 1999
0.097
-0.014
-12.94%
jan 1, 2000
0.161
+0.064
65.46%
jan 1, 2001
0.299
+0.138
85.98%
jan 1, 2002
0.575
+0.275
92.01%
jan 1, 2003
0.436
-0.139
-24.18%
jan 1, 2004
1.753
+1.317
302.42%
jan 1, 2005
25.985
+24.232
1.38K%
jan 1, 2006
29.199
+3.213
12.37%
jan 1, 2007
35.539
+6.34
21.71%
jan 1, 2008
36.617
+1.078
3.03%
jan 1, 2009
35.077
-1.54
-4.21%
jan 1, 2010
43.287
+8.21
23.4%
jan 1, 2011
45.808
+2.521
5.82%
jan 1, 2012
40.01
-5.797
-12.66%
jan 1, 2013
40.341
+0.33
0.83%
jan 1, 2014
39.837
-0.504
-1.25%
jan 1, 2015
43.917
+4.08
10.24%
Ranking of countries by current statistics by years


Comments: