29
/
en
AIzaSyAYiBZKx7MnpbEhh9jyipgxe19OcubqV5w
April 1, 2024
109940
Congo, Dem. Rep.
COD
true
2
1
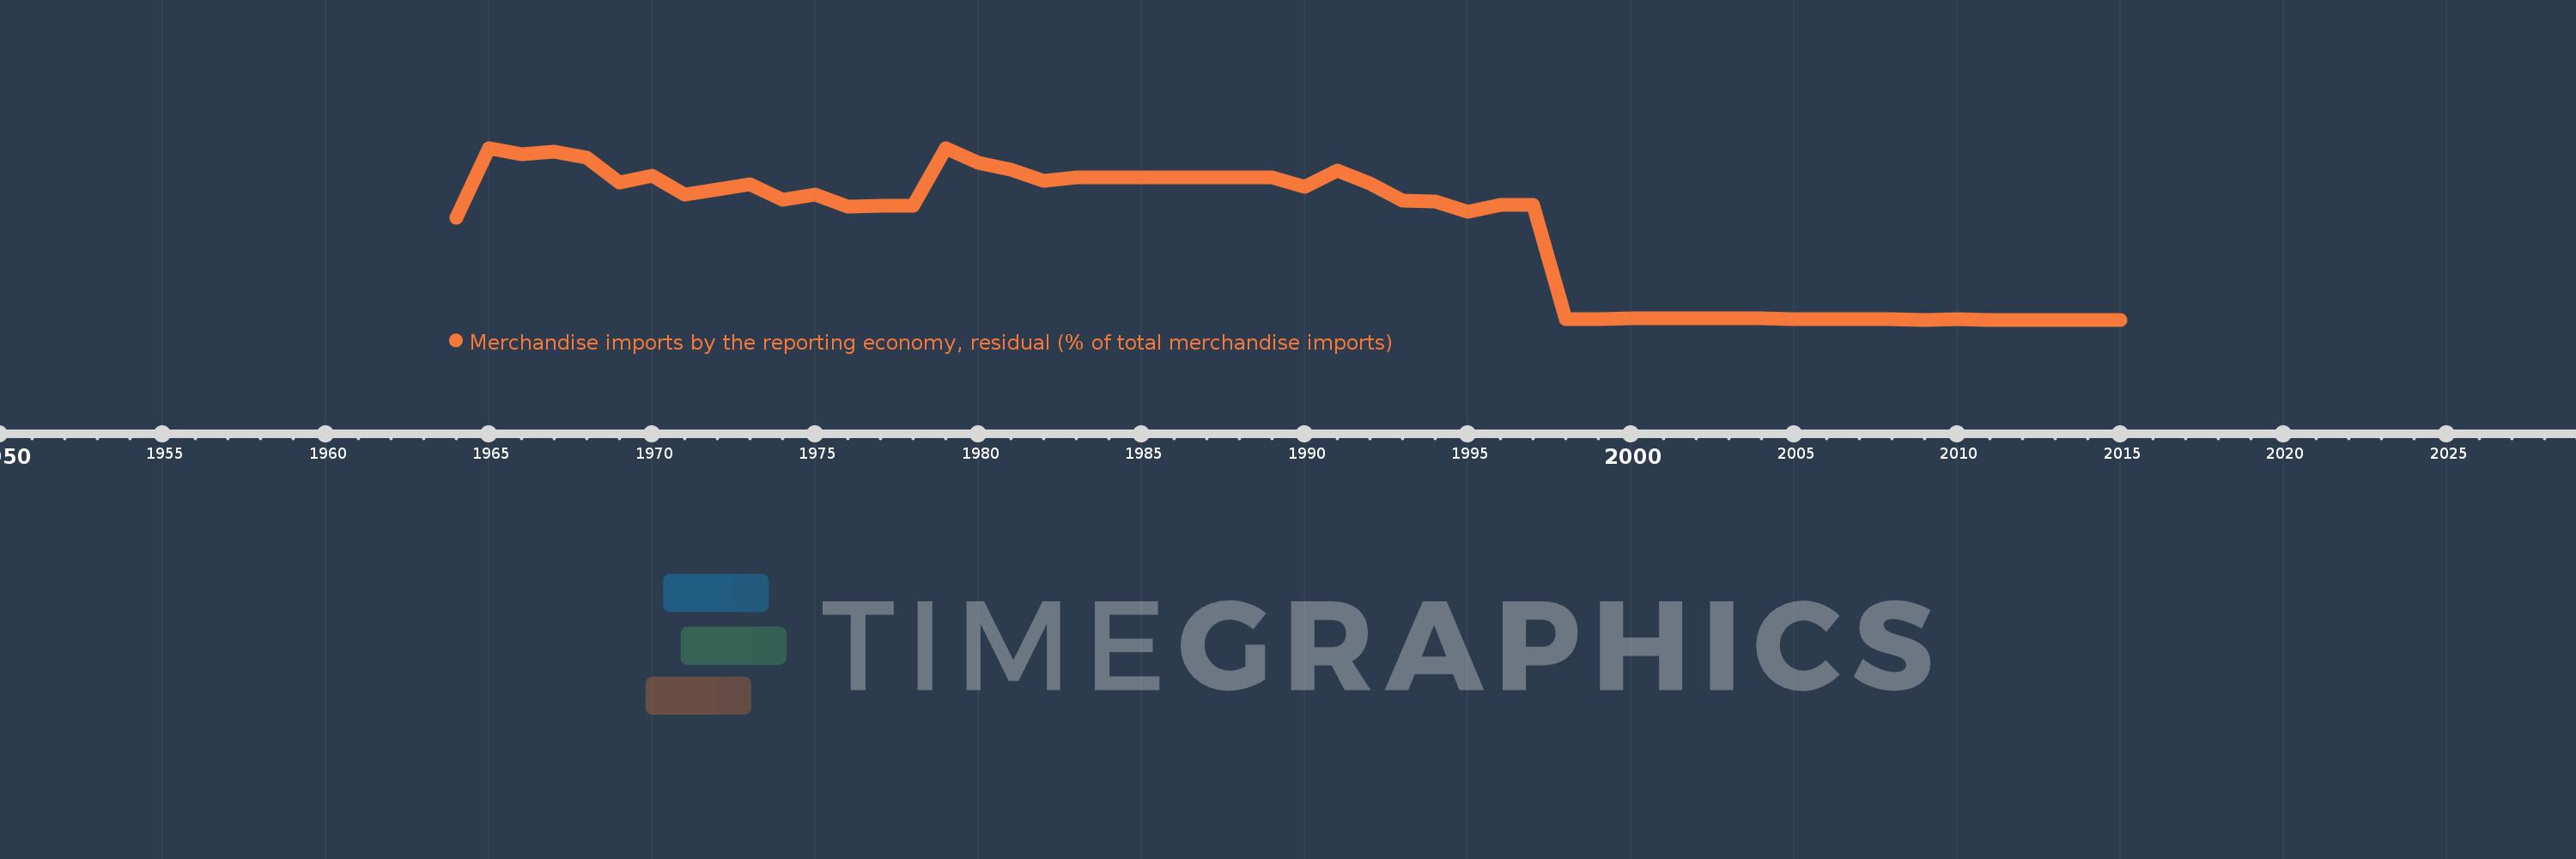
Merchandise imports by the reporting economy, residual (% of total merchandise imports)
2015,2014,2013,2012,2011,2010,2009,2008,2007,2006,2005,2004,2003,2002,2001,2000,1999,1998,1997,1996,1995,1994,1993,1992,1991,1990,1989,1988,1987,1986,1985,1984,1983,1982,1981,1980,1979,1978,1977,1976,1975,1974,1973,1971,1970,1969,1968,1967,1966,1965,1964
This statistics in other country:
AfghanistanAlbaniaAlgeriaAmerican SamoaAngolaAntigua and BarbudaArab WorldArgentinaArmeniaArubaAustraliaAustriaAzerbaijanBahamas, TheBahrainBangladeshBarbadosBelarusBelgiumBelizeBeninBermudaBoliviaBosnia and HerzegovinaBrazilBrunei DarussalamBulgariaBurkina FasoBurundiCabo VerdeCambodiaCameroonCanadaCaribbean small statesCentral African RepublicCentral Europe and the BalticsChadChileChinaColombiaComorosCongo, Dem. Rep.Congo, Rep.Costa RicaCote d'IvoireCroatiaCubaCyprusCzech RepublicDenmarkDjiboutiDominicaDominican RepublicEarly-demographic dividendEast Asia & PacificEast Asia & Pacific (excluding high income)East Asia & Pacific (IDA & IBRD countries)EcuadorEgypt, Arab Rep.El SalvadorEquatorial GuineaEstoniaEthiopiaEuro areaEurope & Central AsiaEurope & Central Asia (excluding high income)Europe & Central Asia (IDA & IBRD countries)European UnionFaroe IslandsFijiFinlandFragile and conflict affected situationsFranceFrench PolynesiaGabonGambia, TheGeorgiaGermanyGhanaGibraltarGreeceGreenlandGrenadaGuamGuatemalaGuineaGuinea-BissauGuyanaHaitiHeavily indebted poor countries (HIPC)High incomeHondurasHong Kong SAR, ChinaHungaryIBRD onlyIcelandIDA & IBRD totalIDA blendIDA onlyIDA totalIndiaIndonesiaIran, Islamic Rep.IraqIrelandIsraelItalyJamaicaJapanJordanKazakhstanKenyaKiribatiKorea, Dem. People’s Rep.Korea, Rep.KosovoKuwaitKyrgyz RepublicLao PDRLate-demographic dividendLatin America & Caribbean Latin America & Caribbean (excluding high income)Latin America & the Caribbean (IDA & IBRD countries)LatviaLeast developed countries: UN classificationLebanonLiberiaLibyaLithuaniaLow & middle incomeLow incomeLower middle incomeLuxembourgMacao SAR, ChinaMacedonia, FYRMadagascarMalawiMalaysiaMaldivesMaliMaltaMauritaniaMauritiusMexicoMiddle East & North AfricaMiddle East & North Africa (excluding high income)Middle East & North Africa (IDA & IBRD countries)Middle incomeMoldovaMongoliaMontenegroMoroccoMozambiqueMyanmarNauruNepalNetherlandsNew CaledoniaNew ZealandNicaraguaNigerNigeriaNorth AmericaNorwayOECD membersOmanOther small statesPacific island small statesPakistanPanamaPapua New GuineaParaguayPeruPhilippinesPolandPortugalPost-demographic dividendPre-demographic dividendQatarRomaniaRussian FederationRwandaSamoaSao Tome and PrincipeSaudi ArabiaSenegalSerbiaSeychellesSierra LeoneSingaporeSlovak RepublicSloveniaSmall statesSolomon IslandsSomaliaSouth AfricaSouth AsiaSouth Asia (IDA & IBRD)SpainSri LankaSt. Kitts and NevisSt. LuciaSt. Vincent and the GrenadinesSub-Saharan Africa Sub-Saharan Africa (excluding high income)Sub-Saharan Africa (IDA & IBRD countries)SudanSurinameSwedenSwitzerlandSyrian Arab RepublicTajikistanTanzaniaThailandTogoTongaTrinidad and TobagoTunisiaTurkeyTurkmenistanTuvaluUgandaUkraineUnited Arab EmiratesUnited KingdomUnited StatesUpper middle incomeUruguayUzbekistanVanuatuVenezuela, RBVietnamWorldYemen, Rep.ZambiaZimbabwe Timeline:
This timeline shows a graph from 1964 to 2015 of Congo, Dem. Rep.. No data until 1963. Number of actual observations by date: 51.
Source name:
World Development Indicators
Source organization:
World Bank staff estimates based data from International Monetary Fund's Direction of Trade database.
Categories, topics:
Private Sector, Trade
Last updated:
apr 23, 2017
Indicators value changes by year
Maximum:
40.322
jan 1, 1979
At the date of observation
Value
Absolute change
Change from previous value
jan 1, 1964
23.966
+23.966
0.0%
jan 1, 1965
40.18
+16.214
67.65%
jan 1, 1966
38.821
-1.359
-3.38%
jan 1, 1967
39.466
+0.645
1.66%
jan 1, 1968
38.047
-1.419
-3.6%
jan 1, 1969
32.182
-5.865
-15.41%
jan 1, 1970
33.747
+1.565
4.86%
jan 1, 1971
29.317
-4.43
-13.13%
jan 1, 1973
31.738
+2.421
8.26%
jan 1, 1974
28.149
-3.588
-11.31%
jan 1, 1975
29.357
+1.208
4.29%
jan 1, 1976
26.63
-2.728
-9.29%
jan 1, 1977
26.693
+0.063
0.24%
jan 1, 1978
26.769
+0.076
0.29%
jan 1, 1979
40.322
+13.553
50.63%
jan 1, 1980
36.807
-3.516
-8.72%
jan 1, 1981
35.18
-1.627
-4.42%
jan 1, 1982
32.524
-2.655
-7.55%
jan 1, 1983
33.452
+0.928
2.85%
jan 1, 1984
33.452
0.0
0.0%
jan 1, 1985
33.452
+0.0
0.0%
jan 1, 1986
33.452
0.0
0.0%
jan 1, 1987
33.452
0.0
0.0%
jan 1, 1988
33.452
0.0
0.0%
jan 1, 1989
33.452
0.0
0.0%
jan 1, 1990
31.264
-2.188
-6.54%
jan 1, 1991
35.028
+3.763
12.04%
jan 1, 1992
31.963
-3.065
-8.75%
jan 1, 1993
27.931
-4.033
-12.62%
jan 1, 1994
27.799
-0.131
-0.47%
jan 1, 1995
25.39
-2.409
-8.67%
jan 1, 1996
26.964
+1.573
6.2%
jan 1, 1997
26.929
-0.035
-0.13%
jan 1, 1998
0.212
-26.717
-99.21%
jan 1, 1999
0.264
+0.052
24.72%
jan 1, 2000
0.393
+0.129
48.66%
jan 1, 2001
0.404
+0.011
2.73%
jan 1, 2002
0.426
+0.023
5.66%
jan 1, 2003
0.337
-0.09
-21.03%
jan 1, 2004
0.316
-0.02
-6.05%
jan 1, 2005
0.251
-0.065
-20.7%
jan 1, 2006
0.22
-0.031
-12.28%
jan 1, 2007
0.174
-0.046
-20.9%
jan 1, 2008
0.135
-0.039
-22.39%
jan 1, 2009
0.099
-0.036
-26.77%
jan 1, 2010
0.127
+0.028
28.04%
jan 1, 2011
0.109
-0.017
-13.64%
jan 1, 2012
0.085
-0.024
-22.01%
jan 1, 2013
0.076
-0.009
-11.09%
jan 1, 2014
0.073
-0.003
-3.56%
jan 1, 2015
0.076
+0.002
3.37%
Ranking of countries by current statistics by years


Comments: