29
/
en
AIzaSyAYiBZKx7MnpbEhh9jyipgxe19OcubqV5w
April 1, 2024
219841
Papua New Guinea
PNG
true
2
1
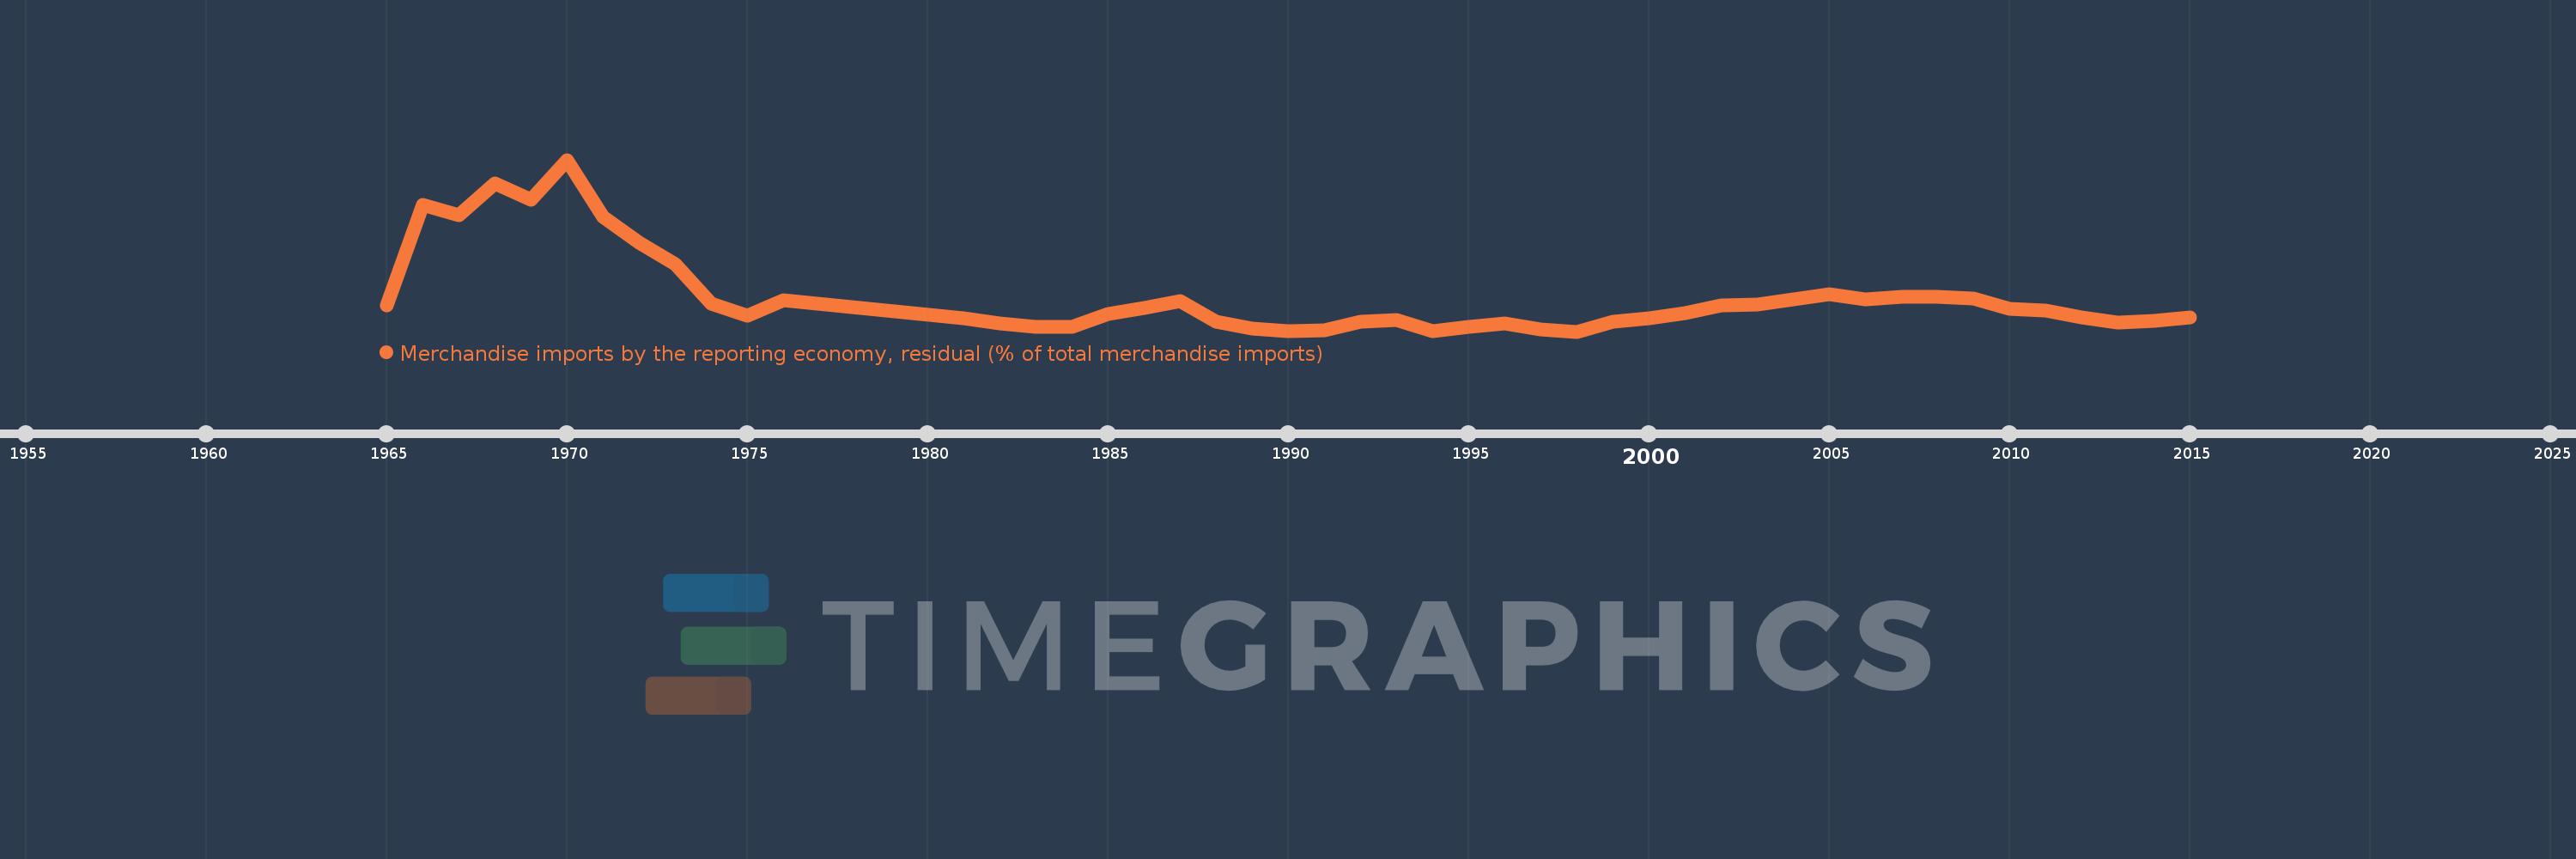
Merchandise imports by the reporting economy, residual (% of total merchandise imports)
2015,2014,2013,2012,2011,2010,2009,2008,2007,2006,2005,2004,2003,2002,2001,2000,1999,1998,1997,1996,1995,1994,1993,1992,1991,1990,1989,1988,1987,1986,1985,1984,1983,1982,1981,1976,1975,1974,1973,1972,1971,1970,1969,1968,1967,1966,1965
This statistics in other country:
AfghanistanAlbaniaAlgeriaAmerican SamoaAngolaAntigua and BarbudaArab WorldArgentinaArmeniaArubaAustraliaAustriaAzerbaijanBahamas, TheBahrainBangladeshBarbadosBelarusBelgiumBelizeBeninBermudaBoliviaBosnia and HerzegovinaBrazilBrunei DarussalamBulgariaBurkina FasoBurundiCabo VerdeCambodiaCameroonCanadaCaribbean small statesCentral African RepublicCentral Europe and the BalticsChadChileChinaColombiaComorosCongo, Dem. Rep.Congo, Rep.Costa RicaCote d'IvoireCroatiaCubaCyprusCzech RepublicDenmarkDjiboutiDominicaDominican RepublicEarly-demographic dividendEast Asia & PacificEast Asia & Pacific (excluding high income)East Asia & Pacific (IDA & IBRD countries)EcuadorEgypt, Arab Rep.El SalvadorEquatorial GuineaEstoniaEthiopiaEuro areaEurope & Central AsiaEurope & Central Asia (excluding high income)Europe & Central Asia (IDA & IBRD countries)European UnionFaroe IslandsFijiFinlandFragile and conflict affected situationsFranceFrench PolynesiaGabonGambia, TheGeorgiaGermanyGhanaGibraltarGreeceGreenlandGrenadaGuamGuatemalaGuineaGuinea-BissauGuyanaHaitiHeavily indebted poor countries (HIPC)High incomeHondurasHong Kong SAR, ChinaHungaryIBRD onlyIcelandIDA & IBRD totalIDA blendIDA onlyIDA totalIndiaIndonesiaIran, Islamic Rep.IraqIrelandIsraelItalyJamaicaJapanJordanKazakhstanKenyaKiribatiKorea, Dem. People’s Rep.Korea, Rep.KosovoKuwaitKyrgyz RepublicLao PDRLate-demographic dividendLatin America & Caribbean Latin America & Caribbean (excluding high income)Latin America & the Caribbean (IDA & IBRD countries)LatviaLeast developed countries: UN classificationLebanonLiberiaLibyaLithuaniaLow & middle incomeLow incomeLower middle incomeLuxembourgMacao SAR, ChinaMacedonia, FYRMadagascarMalawiMalaysiaMaldivesMaliMaltaMauritaniaMauritiusMexicoMiddle East & North AfricaMiddle East & North Africa (excluding high income)Middle East & North Africa (IDA & IBRD countries)Middle incomeMoldovaMongoliaMontenegroMoroccoMozambiqueMyanmarNauruNepalNetherlandsNew CaledoniaNew ZealandNicaraguaNigerNigeriaNorth AmericaNorwayOECD membersOmanOther small statesPacific island small statesPakistanPanamaPapua New GuineaParaguayPeruPhilippinesPolandPortugalPost-demographic dividendPre-demographic dividendQatarRomaniaRussian FederationRwandaSamoaSao Tome and PrincipeSaudi ArabiaSenegalSerbiaSeychellesSierra LeoneSingaporeSlovak RepublicSloveniaSmall statesSolomon IslandsSomaliaSouth AfricaSouth AsiaSouth Asia (IDA & IBRD)SpainSri LankaSt. Kitts and NevisSt. LuciaSt. Vincent and the GrenadinesSub-Saharan Africa Sub-Saharan Africa (excluding high income)Sub-Saharan Africa (IDA & IBRD countries)SudanSurinameSwedenSwitzerlandSyrian Arab RepublicTajikistanTanzaniaThailandTogoTongaTrinidad and TobagoTunisiaTurkeyTurkmenistanTuvaluUgandaUkraineUnited Arab EmiratesUnited KingdomUnited StatesUpper middle incomeUruguayUzbekistanVanuatuVenezuela, RBVietnamWorldYemen, Rep.ZambiaZimbabwe Timeline:
This timeline shows a graph from 1965 to 2015 of Papua New Guinea. No data until 1964. Number of actual observations by date: 47.
Source name:
World Development Indicators
Source organization:
World Bank staff estimates based data from International Monetary Fund's Direction of Trade database.
Categories, topics:
Private Sector, Trade
Last updated:
apr 23, 2017
Indicators value changes by year
At the date of observation
Value
Absolute change
Change from previous value
jan 1, 1965
1.403
+1.403
0.0%
jan 1, 1966
4.752
+3.349
238.71%
jan 1, 1967
4.406
-0.346
-7.29%
jan 1, 1968
5.481
+1.075
24.4%
jan 1, 1969
4.913
-0.568
-10.36%
jan 1, 1970
6.255
+1.341
27.29%
jan 1, 1971
4.355
-1.899
-30.37%
jan 1, 1972
3.49
-0.865
-19.86%
jan 1, 1973
2.775
-0.716
-20.51%
jan 1, 1974
1.465
-1.31
-47.2%
jan 1, 1975
1.073
-0.392
-26.78%
jan 1, 1976
1.562
+0.489
45.57%
jan 1, 1981
0.984
-0.578
-37.01%
jan 1, 1982
0.816
-0.167
-17.02%
jan 1, 1983
0.699
-0.117
-14.36%
jan 1, 1984
0.702
+0.003
0.42%
jan 1, 1985
1.13
+0.428
60.91%
jan 1, 1986
1.328
+0.199
17.6%
jan 1, 1987
1.539
+0.21
15.83%
jan 1, 1988
0.874
-0.664
-43.17%
jan 1, 1989
0.638
-0.237
-27.09%
jan 1, 1990
0.536
-0.102
-16.0%
jan 1, 1991
0.579
+0.044
8.15%
jan 1, 1992
0.856
+0.277
47.78%
jan 1, 1993
0.914
+0.058
6.75%
jan 1, 1994
0.546
-0.368
-40.29%
jan 1, 1995
0.702
+0.157
28.76%
jan 1, 1996
0.802
+0.1
14.23%
jan 1, 1997
0.602
-0.2
-24.91%
jan 1, 1998
0.531
-0.072
-11.91%
jan 1, 1999
0.871
+0.341
64.18%
jan 1, 2000
0.982
+0.111
12.69%
jan 1, 2001
1.159
+0.177
18.06%
jan 1, 2002
1.407
+0.248
21.37%
jan 1, 2003
1.429
+0.022
1.57%
jan 1, 2004
1.6
+0.171
11.93%
jan 1, 2005
1.765
+0.165
10.31%
jan 1, 2006
1.604
-0.16
-9.07%
jan 1, 2007
1.694
+0.089
5.57%
jan 1, 2008
1.677
-0.017
-0.98%
jan 1, 2009
1.621
-0.056
-3.34%
jan 1, 2010
1.283
-0.338
-20.83%
jan 1, 2011
1.246
-0.037
-2.91%
jan 1, 2012
0.99
-0.256
-20.53%
jan 1, 2013
0.821
-0.169
-17.08%
jan 1, 2014
0.894
+0.073
8.85%
jan 1, 2015
1.003
+0.109
12.2%
Ranking of countries by current statistics by years


Comments: