29
/
en
AIzaSyAYiBZKx7MnpbEhh9jyipgxe19OcubqV5w
April 1, 2024
160740
Israel
ISR
true
2
1
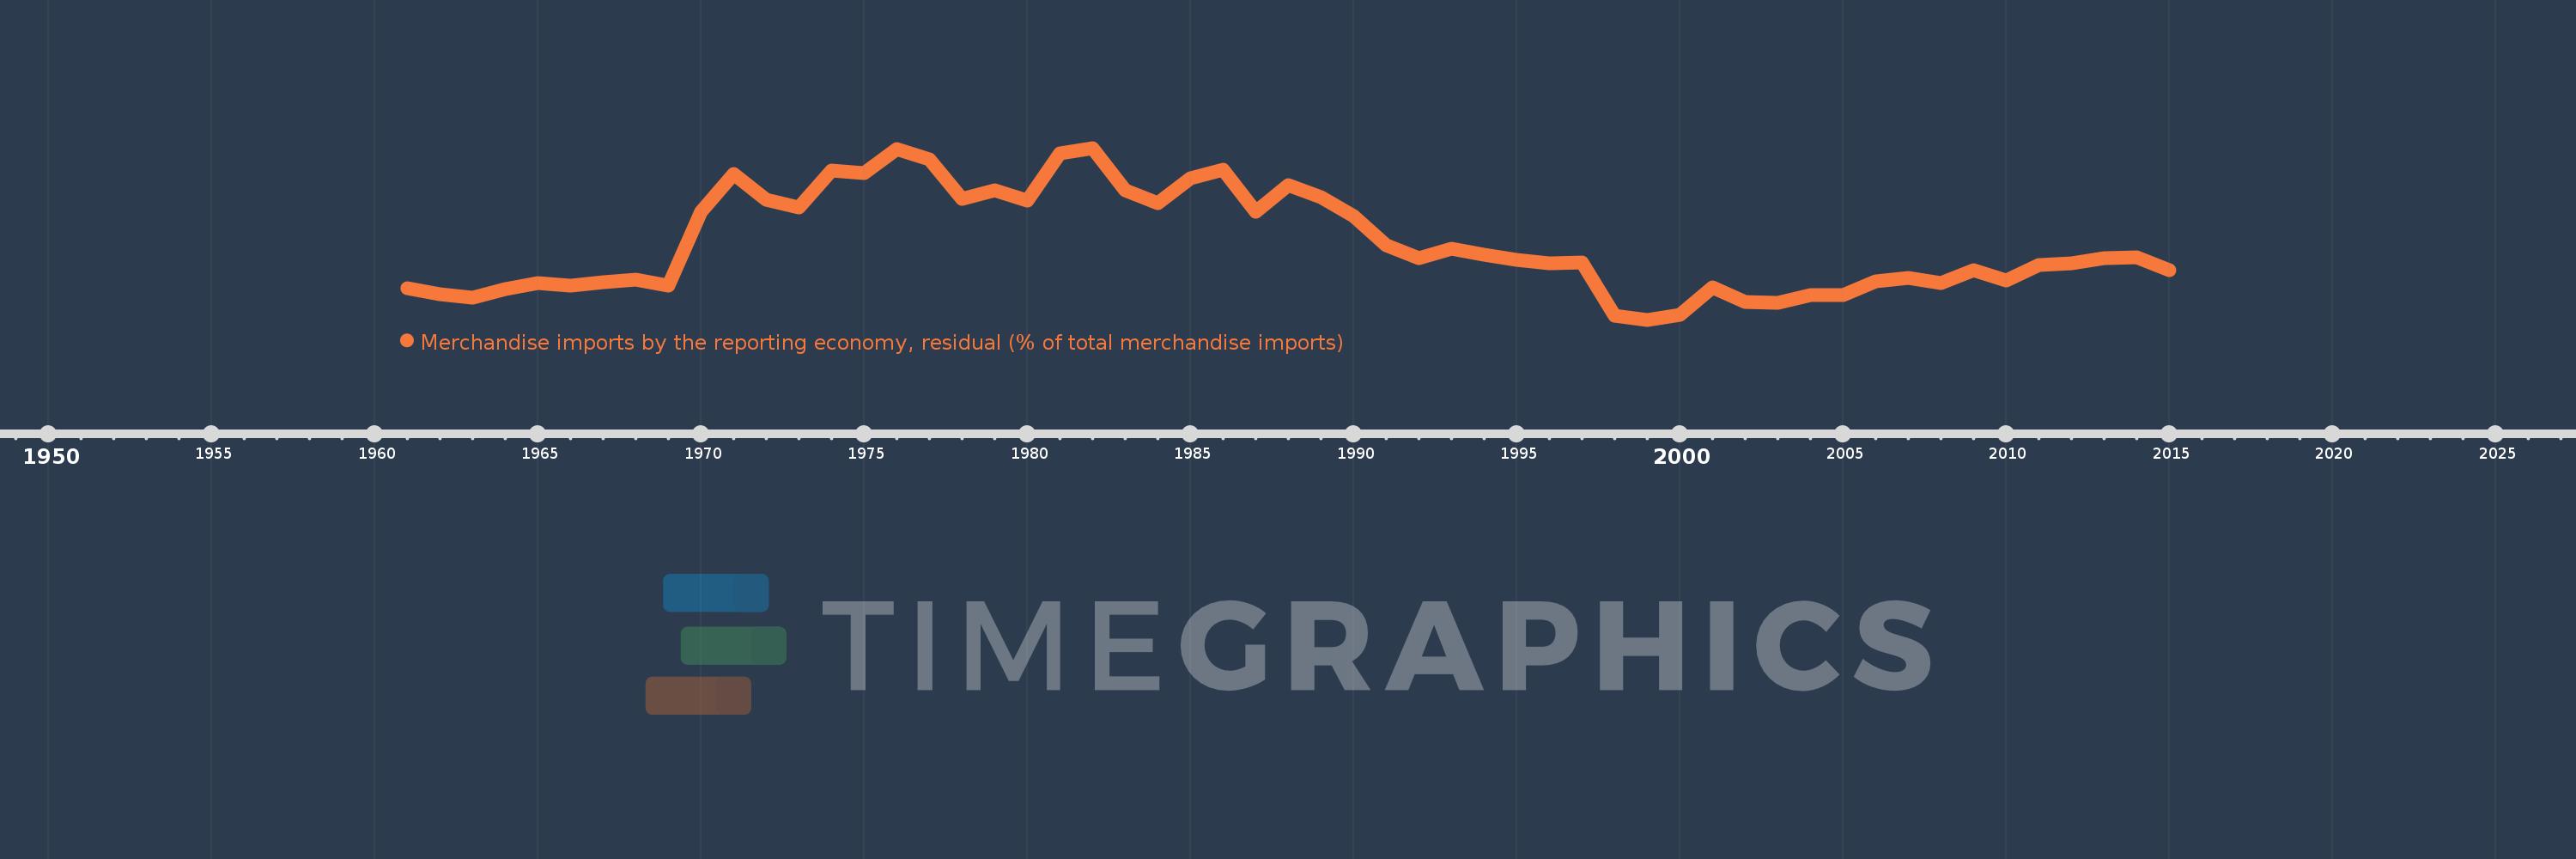
Merchandise imports by the reporting economy, residual (% of total merchandise imports)
2015,2014,2013,2012,2011,2010,2009,2008,2007,2006,2005,2004,2003,2002,2001,2000,1999,1998,1997,1996,1995,1994,1993,1992,1991,1990,1989,1988,1987,1986,1985,1984,1983,1982,1981,1980,1979,1978,1977,1976,1975,1974,1973,1972,1971,1970,1969,1968,1967,1966,1965,1964,1963,1962,1961
This statistics in other country:
AfghanistanAlbaniaAlgeriaAmerican SamoaAngolaAntigua and BarbudaArab WorldArgentinaArmeniaArubaAustraliaAustriaAzerbaijanBahamas, TheBahrainBangladeshBarbadosBelarusBelgiumBelizeBeninBermudaBoliviaBosnia and HerzegovinaBrazilBrunei DarussalamBulgariaBurkina FasoBurundiCabo VerdeCambodiaCameroonCanadaCaribbean small statesCentral African RepublicCentral Europe and the BalticsChadChileChinaColombiaComorosCongo, Dem. Rep.Congo, Rep.Costa RicaCote d'IvoireCroatiaCubaCyprusCzech RepublicDenmarkDjiboutiDominicaDominican RepublicEarly-demographic dividendEast Asia & PacificEast Asia & Pacific (excluding high income)East Asia & Pacific (IDA & IBRD countries)EcuadorEgypt, Arab Rep.El SalvadorEquatorial GuineaEstoniaEthiopiaEuro areaEurope & Central AsiaEurope & Central Asia (excluding high income)Europe & Central Asia (IDA & IBRD countries)European UnionFaroe IslandsFijiFinlandFragile and conflict affected situationsFranceFrench PolynesiaGabonGambia, TheGeorgiaGermanyGhanaGibraltarGreeceGreenlandGrenadaGuamGuatemalaGuineaGuinea-BissauGuyanaHaitiHeavily indebted poor countries (HIPC)High incomeHondurasHong Kong SAR, ChinaHungaryIBRD onlyIcelandIDA & IBRD totalIDA blendIDA onlyIDA totalIndiaIndonesiaIran, Islamic Rep.IraqIrelandIsraelItalyJamaicaJapanJordanKazakhstanKenyaKiribatiKorea, Dem. People’s Rep.Korea, Rep.KosovoKuwaitKyrgyz RepublicLao PDRLate-demographic dividendLatin America & Caribbean Latin America & Caribbean (excluding high income)Latin America & the Caribbean (IDA & IBRD countries)LatviaLeast developed countries: UN classificationLebanonLiberiaLibyaLithuaniaLow & middle incomeLow incomeLower middle incomeLuxembourgMacao SAR, ChinaMacedonia, FYRMadagascarMalawiMalaysiaMaldivesMaliMaltaMauritaniaMauritiusMexicoMiddle East & North AfricaMiddle East & North Africa (excluding high income)Middle East & North Africa (IDA & IBRD countries)Middle incomeMoldovaMongoliaMontenegroMoroccoMozambiqueMyanmarNauruNepalNetherlandsNew CaledoniaNew ZealandNicaraguaNigerNigeriaNorth AmericaNorwayOECD membersOmanOther small statesPacific island small statesPakistanPanamaPapua New GuineaParaguayPeruPhilippinesPolandPortugalPost-demographic dividendPre-demographic dividendQatarRomaniaRussian FederationRwandaSamoaSao Tome and PrincipeSaudi ArabiaSenegalSerbiaSeychellesSierra LeoneSingaporeSlovak RepublicSloveniaSmall statesSolomon IslandsSomaliaSouth AfricaSouth AsiaSouth Asia (IDA & IBRD)SpainSri LankaSt. Kitts and NevisSt. LuciaSt. Vincent and the GrenadinesSub-Saharan Africa Sub-Saharan Africa (excluding high income)Sub-Saharan Africa (IDA & IBRD countries)SudanSurinameSwedenSwitzerlandSyrian Arab RepublicTajikistanTanzaniaThailandTogoTongaTrinidad and TobagoTunisiaTurkeyTurkmenistanTuvaluUgandaUkraineUnited Arab EmiratesUnited KingdomUnited StatesUpper middle incomeUruguayUzbekistanVanuatuVenezuela, RBVietnamWorldYemen, Rep.ZambiaZimbabwe Timeline:
This timeline shows a graph from 1961 to 2015 of Israel. No data until 1960. Number of actual observations by date: 55.
Source name:
World Development Indicators
Source organization:
World Bank staff estimates based data from International Monetary Fund's Direction of Trade database.
Categories, topics:
Private Sector, Trade
Last updated:
apr 23, 2017
Indicators value changes by year
Maximum:
45.298
jan 1, 1982
At the date of observation
Value
Absolute change
Change from previous value
jan 1, 1961
12.8
+12.8
0.0%
jan 1, 1962
11.445
-1.355
-10.58%
jan 1, 1963
10.758
-0.687
-6.01%
jan 1, 1964
12.702
+1.945
18.08%
jan 1, 1965
14.054
+1.352
10.64%
jan 1, 1966
13.489
-0.566
-4.03%
jan 1, 1967
14.214
+0.726
5.38%
jan 1, 1968
14.975
+0.761
5.35%
jan 1, 1969
13.482
-1.493
-9.97%
jan 1, 1970
30.482
+17.0
126.09%
jan 1, 1971
39.26
+8.778
28.8%
jan 1, 1972
33.344
-5.917
-15.07%
jan 1, 1973
31.487
-1.857
-5.57%
jan 1, 1974
40.052
+8.565
27.2%
jan 1, 1975
39.499
-0.553
-1.38%
jan 1, 1976
44.943
+5.444
13.78%
jan 1, 1977
42.749
-2.194
-4.88%
jan 1, 1978
33.62
-9.129
-21.35%
jan 1, 1979
35.463
+1.843
5.48%
jan 1, 1980
33.105
-2.358
-6.65%
jan 1, 1981
44.07
+10.965
33.12%
jan 1, 1982
45.298
+1.227
2.79%
jan 1, 1983
35.589
-9.709
-21.43%
jan 1, 1984
32.584
-3.004
-8.44%
jan 1, 1985
38.372
+5.788
17.76%
jan 1, 1986
40.301
+1.929
5.03%
jan 1, 1987
30.469
-9.832
-24.4%
jan 1, 1988
36.699
+6.23
20.45%
jan 1, 1989
33.965
-2.733
-7.45%
jan 1, 1990
29.641
-4.325
-12.73%
jan 1, 1991
22.846
-6.794
-22.92%
jan 1, 1992
19.816
-3.03
-13.26%
jan 1, 1993
22.114
+2.298
11.59%
jan 1, 1994
20.725
-1.389
-6.28%
jan 1, 1995
19.454
-1.271
-6.13%
jan 1, 1996
18.74
-0.714
-3.67%
jan 1, 1997
18.778
+0.038
0.2%
jan 1, 1998
6.595
-12.183
-64.88%
jan 1, 1999
5.612
-0.983
-14.9%
jan 1, 2000
6.732
+1.12
19.96%
jan 1, 2001
13.167
+6.435
95.59%
jan 1, 2002
9.791
-3.376
-25.64%
jan 1, 2003
9.458
-0.333
-3.4%
jan 1, 2004
11.406
+1.948
20.6%
jan 1, 2005
11.393
-0.013
-0.12%
jan 1, 2006
14.418
+3.025
26.55%
jan 1, 2007
15.185
+0.767
5.32%
jan 1, 2008
14.015
-1.17
-7.7%
jan 1, 2009
17.109
+3.095
22.08%
jan 1, 2010
14.593
-2.517
-14.71%
jan 1, 2011
18.201
+3.608
24.73%
jan 1, 2012
18.589
+0.388
2.13%
jan 1, 2013
19.758
+1.17
6.29%
jan 1, 2014
20.085
+0.327
1.65%
jan 1, 2015
17.073
-3.012
-14.99%
Ranking of countries by current statistics by years


Comments: