29
/
en
AIzaSyAYiBZKx7MnpbEhh9jyipgxe19OcubqV5w
April 1, 2024
103868
Chad
TCD
true
2
1
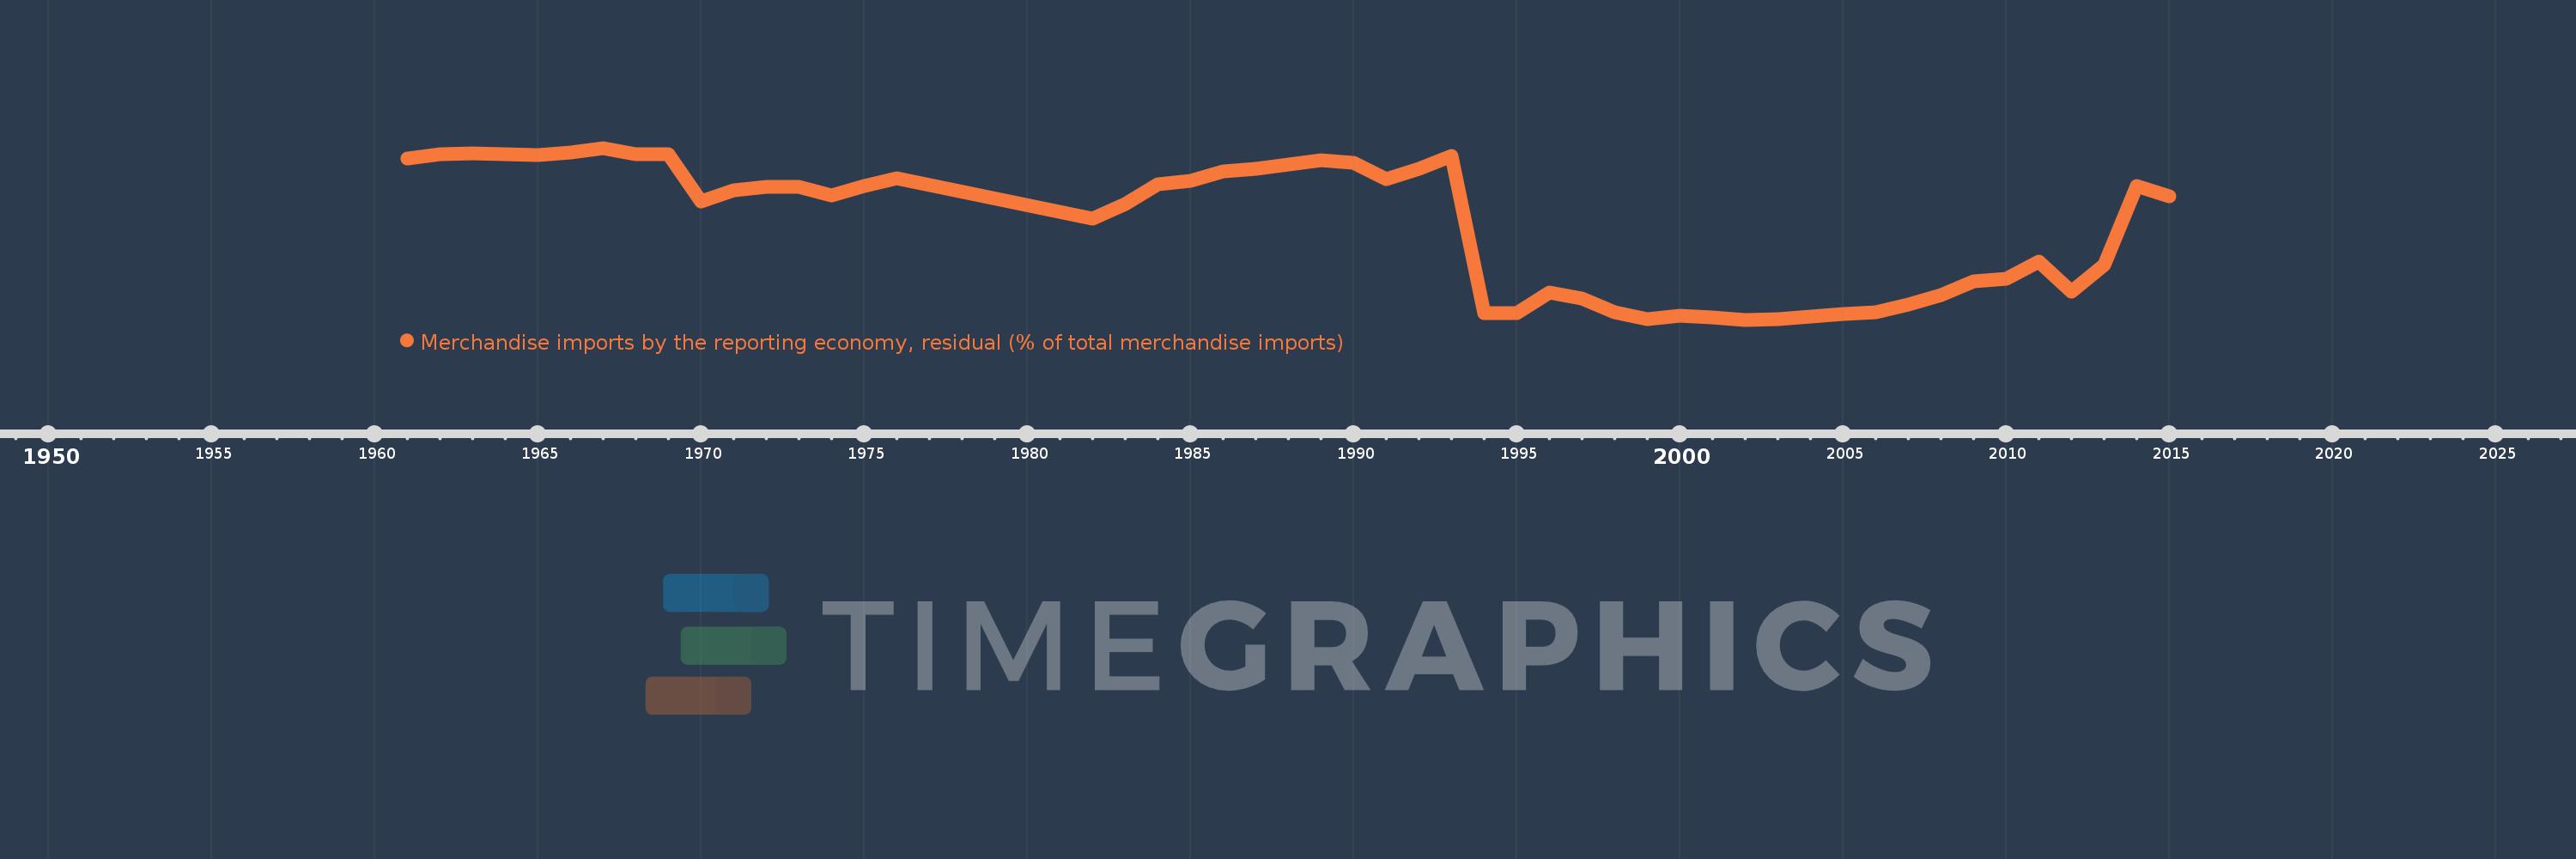
Merchandise imports by the reporting economy, residual (% of total merchandise imports)
2015,2014,2013,2012,2011,2010,2009,2008,2007,2006,2005,2004,2003,2002,2001,2000,1999,1998,1997,1996,1995,1994,1993,1992,1991,1990,1989,1988,1987,1986,1985,1984,1983,1982,1976,1975,1974,1973,1972,1971,1970,1969,1968,1967,1966,1965,1964,1963,1962,1961
This statistics in other country:
AfghanistanAlbaniaAlgeriaAmerican SamoaAngolaAntigua and BarbudaArab WorldArgentinaArmeniaArubaAustraliaAustriaAzerbaijanBahamas, TheBahrainBangladeshBarbadosBelarusBelgiumBelizeBeninBermudaBoliviaBosnia and HerzegovinaBrazilBrunei DarussalamBulgariaBurkina FasoBurundiCabo VerdeCambodiaCameroonCanadaCaribbean small statesCentral African RepublicCentral Europe and the BalticsChadChileChinaColombiaComorosCongo, Dem. Rep.Congo, Rep.Costa RicaCote d'IvoireCroatiaCubaCyprusCzech RepublicDenmarkDjiboutiDominicaDominican RepublicEarly-demographic dividendEast Asia & PacificEast Asia & Pacific (excluding high income)East Asia & Pacific (IDA & IBRD countries)EcuadorEgypt, Arab Rep.El SalvadorEquatorial GuineaEstoniaEthiopiaEuro areaEurope & Central AsiaEurope & Central Asia (excluding high income)Europe & Central Asia (IDA & IBRD countries)European UnionFaroe IslandsFijiFinlandFragile and conflict affected situationsFranceFrench PolynesiaGabonGambia, TheGeorgiaGermanyGhanaGibraltarGreeceGreenlandGrenadaGuamGuatemalaGuineaGuinea-BissauGuyanaHaitiHeavily indebted poor countries (HIPC)High incomeHondurasHong Kong SAR, ChinaHungaryIBRD onlyIcelandIDA & IBRD totalIDA blendIDA onlyIDA totalIndiaIndonesiaIran, Islamic Rep.IraqIrelandIsraelItalyJamaicaJapanJordanKazakhstanKenyaKiribatiKorea, Dem. People’s Rep.Korea, Rep.KosovoKuwaitKyrgyz RepublicLao PDRLate-demographic dividendLatin America & Caribbean Latin America & Caribbean (excluding high income)Latin America & the Caribbean (IDA & IBRD countries)LatviaLeast developed countries: UN classificationLebanonLiberiaLibyaLithuaniaLow & middle incomeLow incomeLower middle incomeLuxembourgMacao SAR, ChinaMacedonia, FYRMadagascarMalawiMalaysiaMaldivesMaliMaltaMauritaniaMauritiusMexicoMiddle East & North AfricaMiddle East & North Africa (excluding high income)Middle East & North Africa (IDA & IBRD countries)Middle incomeMoldovaMongoliaMontenegroMoroccoMozambiqueMyanmarNauruNepalNetherlandsNew CaledoniaNew ZealandNicaraguaNigerNigeriaNorth AmericaNorwayOECD membersOmanOther small statesPacific island small statesPakistanPanamaPapua New GuineaParaguayPeruPhilippinesPolandPortugalPost-demographic dividendPre-demographic dividendQatarRomaniaRussian FederationRwandaSamoaSao Tome and PrincipeSaudi ArabiaSenegalSerbiaSeychellesSierra LeoneSingaporeSlovak RepublicSloveniaSmall statesSolomon IslandsSomaliaSouth AfricaSouth AsiaSouth Asia (IDA & IBRD)SpainSri LankaSt. Kitts and NevisSt. LuciaSt. Vincent and the GrenadinesSub-Saharan Africa Sub-Saharan Africa (excluding high income)Sub-Saharan Africa (IDA & IBRD countries)SudanSurinameSwedenSwitzerlandSyrian Arab RepublicTajikistanTanzaniaThailandTogoTongaTrinidad and TobagoTunisiaTurkeyTurkmenistanTuvaluUgandaUkraineUnited Arab EmiratesUnited KingdomUnited StatesUpper middle incomeUruguayUzbekistanVanuatuVenezuela, RBVietnamWorldYemen, Rep.ZambiaZimbabwe Timeline:
This timeline shows a graph from 1961 to 2015 of Chad. No data until 1960. Number of actual observations by date: 50.
Source name:
World Development Indicators
Source organization:
World Bank staff estimates based data from International Monetary Fund's Direction of Trade database.
Categories, topics:
Private Sector, Trade
Last updated:
apr 23, 2017
Indicators value changes by year
Maximum:
95.597
jan 1, 1967
At the date of observation
Value
Absolute change
Change from previous value
jan 1, 1961
90.0
+90.0
0.0%
jan 1, 1962
92.43
+2.43
2.7%
jan 1, 1963
92.466
+0.035
0.04%
jan 1, 1964
92.414
-0.052
-0.06%
jan 1, 1965
91.954
-0.46
-0.5%
jan 1, 1966
93.204
+1.25
1.36%
jan 1, 1967
95.597
+2.394
2.57%
jan 1, 1968
92.231
-3.367
-3.52%
jan 1, 1969
92.164
-0.066
-0.07%
jan 1, 1970
66.757
-25.407
-27.57%
jan 1, 1971
72.815
+6.058
9.07%
jan 1, 1972
74.866
+2.051
2.82%
jan 1, 1973
74.934
+0.068
0.09%
jan 1, 1974
70.063
-4.871
-6.5%
jan 1, 1975
75.139
+5.076
7.25%
jan 1, 1976
79.102
+3.963
5.27%
jan 1, 1982
57.708
-21.394
-27.05%
jan 1, 1983
65.473
+7.765
13.46%
jan 1, 1984
76.002
+10.529
16.08%
jan 1, 1985
77.992
+1.99
2.62%
jan 1, 1986
82.922
+4.93
6.32%
jan 1, 1987
84.566
+1.644
1.98%
jan 1, 1988
86.499
+1.934
2.29%
jan 1, 1989
89.037
+2.538
2.93%
jan 1, 1990
87.477
-1.56
-1.75%
jan 1, 1991
78.683
-8.794
-10.05%
jan 1, 1992
84.463
+5.779
7.35%
jan 1, 1993
91.504
+7.042
8.34%
jan 1, 1994
6.833
-84.672
-92.53%
jan 1, 1995
7.205
+0.373
5.46%
jan 1, 1996
18.205
+11.0
152.66%
jan 1, 1997
14.585
-3.62
-19.88%
jan 1, 1998
7.467
-7.118
-48.8%
jan 1, 1999
3.575
-3.892
-52.13%
jan 1, 2000
5.772
+2.197
61.46%
jan 1, 2001
4.592
-1.18
-20.44%
jan 1, 2002
3.427
-1.166
-25.38%
jan 1, 2003
3.776
+0.349
10.19%
jan 1, 2004
5.176
+1.4
37.07%
jan 1, 2005
6.354
+1.179
22.78%
jan 1, 2006
7.32
+0.966
15.2%
jan 1, 2007
11.81
+4.49
61.33%
jan 1, 2008
16.815
+5.006
42.38%
jan 1, 2009
23.867
+7.052
41.94%
jan 1, 2010
25.292
+1.425
5.97%
jan 1, 2011
34.503
+9.211
36.42%
jan 1, 2012
18.69
-15.813
-45.83%
jan 1, 2013
32.963
+14.273
76.37%
jan 1, 2014
74.957
+41.993
127.39%
jan 1, 2015
69.464
-5.493
-7.33%
Ranking of countries by current statistics by years


Comments: