29
/
en
AIzaSyAYiBZKx7MnpbEhh9jyipgxe19OcubqV5w
April 1, 2024
127561
Equatorial Guinea
GNQ
true
2
1
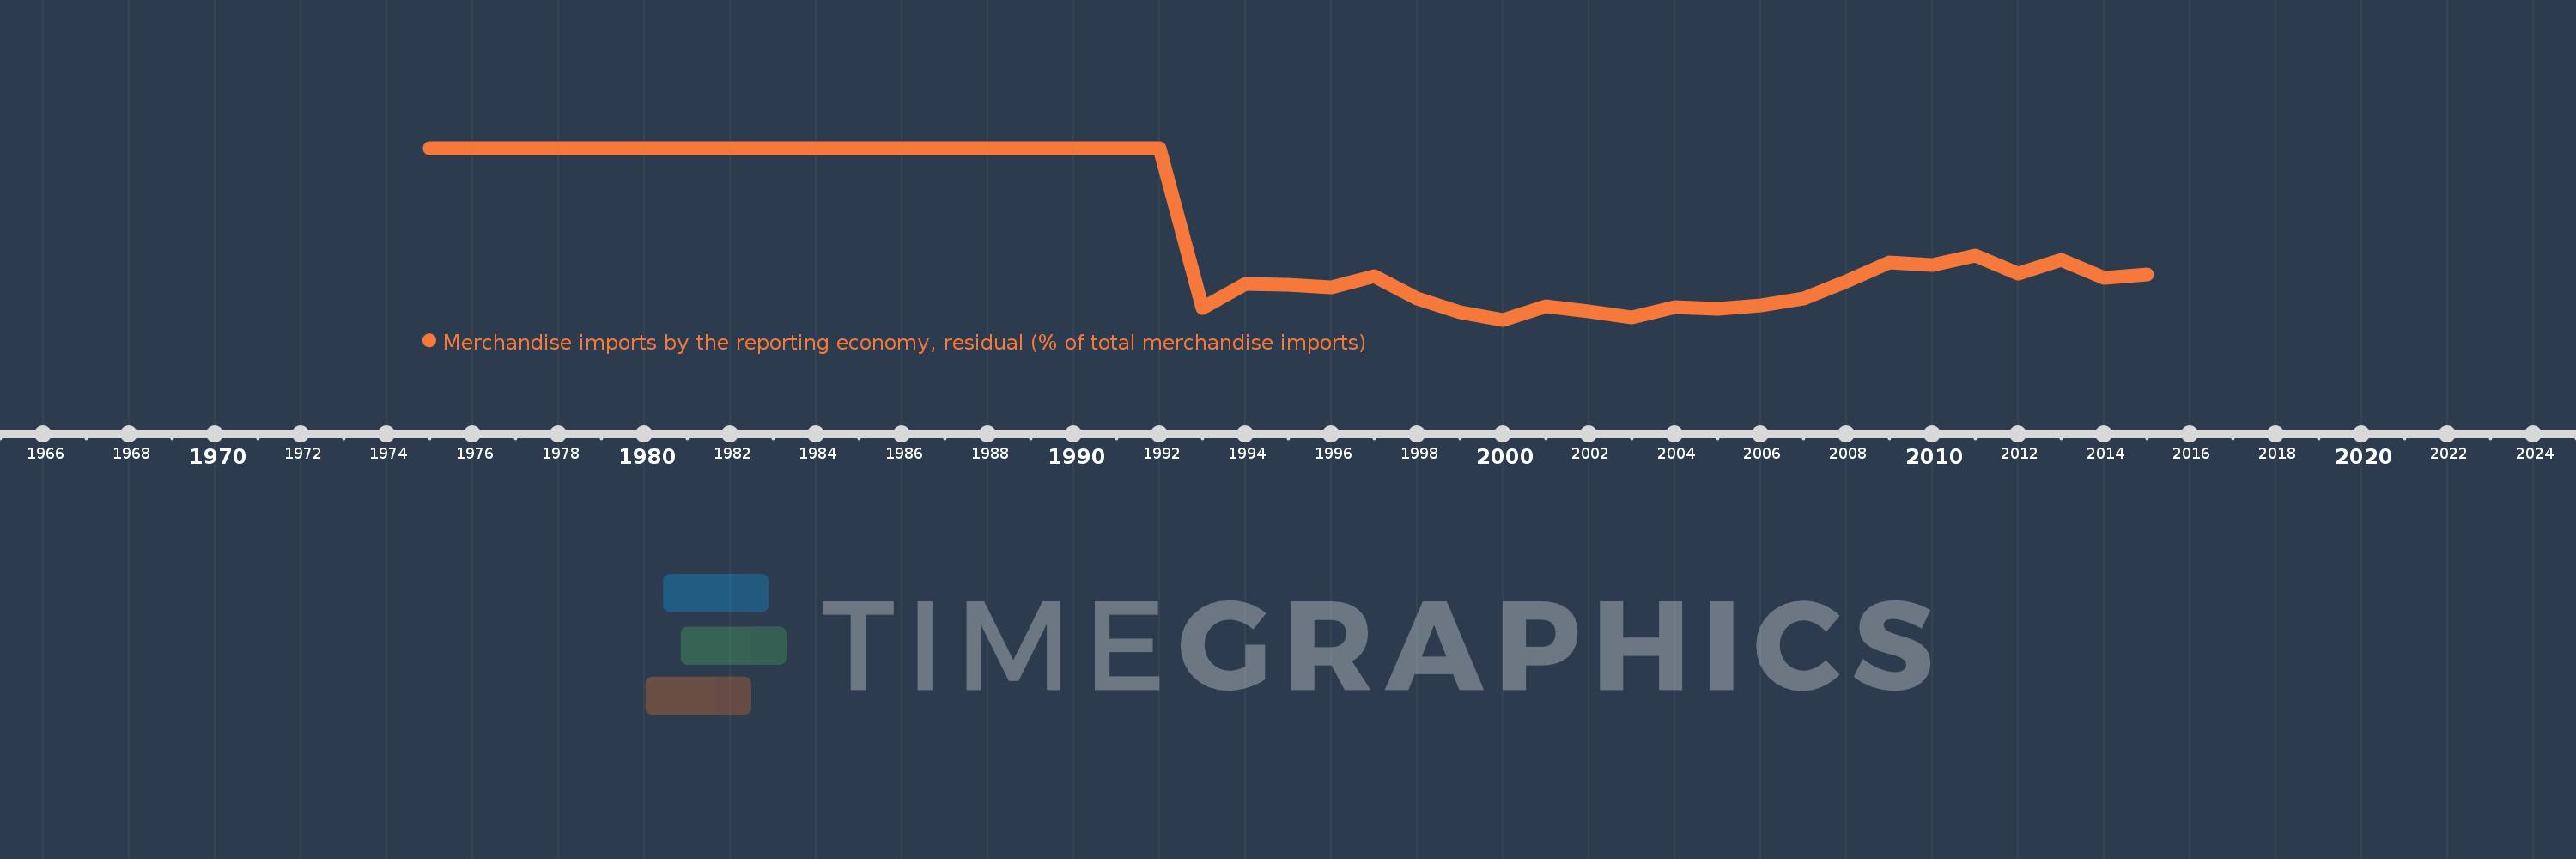
Merchandise imports by the reporting economy, residual (% of total merchandise imports)
2015,2014,2013,2012,2011,2010,2009,2008,2007,2006,2005,2004,2003,2002,2001,2000,1999,1998,1997,1996,1995,1994,1993,1992,1991,1990,1989,1988,1987,1986,1985,1984,1983,1982,1978,1977,1976,1975
This statistics in other country:
AfghanistanAlbaniaAlgeriaAmerican SamoaAngolaAntigua and BarbudaArab WorldArgentinaArmeniaArubaAustraliaAustriaAzerbaijanBahamas, TheBahrainBangladeshBarbadosBelarusBelgiumBelizeBeninBermudaBoliviaBosnia and HerzegovinaBrazilBrunei DarussalamBulgariaBurkina FasoBurundiCabo VerdeCambodiaCameroonCanadaCaribbean small statesCentral African RepublicCentral Europe and the BalticsChadChileChinaColombiaComorosCongo, Dem. Rep.Congo, Rep.Costa RicaCote d'IvoireCroatiaCubaCyprusCzech RepublicDenmarkDjiboutiDominicaDominican RepublicEarly-demographic dividendEast Asia & PacificEast Asia & Pacific (excluding high income)East Asia & Pacific (IDA & IBRD countries)EcuadorEgypt, Arab Rep.El SalvadorEquatorial GuineaEstoniaEthiopiaEuro areaEurope & Central AsiaEurope & Central Asia (excluding high income)Europe & Central Asia (IDA & IBRD countries)European UnionFaroe IslandsFijiFinlandFragile and conflict affected situationsFranceFrench PolynesiaGabonGambia, TheGeorgiaGermanyGhanaGibraltarGreeceGreenlandGrenadaGuamGuatemalaGuineaGuinea-BissauGuyanaHaitiHeavily indebted poor countries (HIPC)High incomeHondurasHong Kong SAR, ChinaHungaryIBRD onlyIcelandIDA & IBRD totalIDA blendIDA onlyIDA totalIndiaIndonesiaIran, Islamic Rep.IraqIrelandIsraelItalyJamaicaJapanJordanKazakhstanKenyaKiribatiKorea, Dem. People’s Rep.Korea, Rep.KosovoKuwaitKyrgyz RepublicLao PDRLate-demographic dividendLatin America & Caribbean Latin America & Caribbean (excluding high income)Latin America & the Caribbean (IDA & IBRD countries)LatviaLeast developed countries: UN classificationLebanonLiberiaLibyaLithuaniaLow & middle incomeLow incomeLower middle incomeLuxembourgMacao SAR, ChinaMacedonia, FYRMadagascarMalawiMalaysiaMaldivesMaliMaltaMauritaniaMauritiusMexicoMiddle East & North AfricaMiddle East & North Africa (excluding high income)Middle East & North Africa (IDA & IBRD countries)Middle incomeMoldovaMongoliaMontenegroMoroccoMozambiqueMyanmarNauruNepalNetherlandsNew CaledoniaNew ZealandNicaraguaNigerNigeriaNorth AmericaNorwayOECD membersOmanOther small statesPacific island small statesPakistanPanamaPapua New GuineaParaguayPeruPhilippinesPolandPortugalPost-demographic dividendPre-demographic dividendQatarRomaniaRussian FederationRwandaSamoaSao Tome and PrincipeSaudi ArabiaSenegalSerbiaSeychellesSierra LeoneSingaporeSlovak RepublicSloveniaSmall statesSolomon IslandsSomaliaSouth AfricaSouth AsiaSouth Asia (IDA & IBRD)SpainSri LankaSt. Kitts and NevisSt. LuciaSt. Vincent and the GrenadinesSub-Saharan Africa Sub-Saharan Africa (excluding high income)Sub-Saharan Africa (IDA & IBRD countries)SudanSurinameSwedenSwitzerlandSyrian Arab RepublicTajikistanTanzaniaThailandTogoTongaTrinidad and TobagoTunisiaTurkeyTurkmenistanTuvaluUgandaUkraineUnited Arab EmiratesUnited KingdomUnited StatesUpper middle incomeUruguayUzbekistanVanuatuVenezuela, RBVietnamWorldYemen, Rep.ZambiaZimbabwe Timeline:
This timeline shows a graph from 1975 to 2015 of Equatorial Guinea. No data until 1974. Number of actual observations by date: 38.
Source name:
World Development Indicators
Source organization:
World Bank staff estimates based data from International Monetary Fund's Direction of Trade database.
Categories, topics:
Private Sector, Trade
Last updated:
apr 23, 2017
Indicators value changes by year
At the date of observation
Value
Absolute change
Change from previous value
jan 1, 1975
100.0
+100.0
0.0%
jan 1, 1976
100.0
0.0
0.0%
jan 1, 1977
100.0
0.0
0.0%
jan 1, 1978
100.0
0.0
0.0%
jan 1, 1982
100.0
0.0
0.0%
jan 1, 1983
100.0
0.0
0.0%
jan 1, 1984
100.0
0.0
0.0%
jan 1, 1985
100.0
0.0
0.0%
jan 1, 1986
100.0
0.0
0.0%
jan 1, 1987
100.0
0.0
0.0%
jan 1, 1988
100.0
0.0
0.0%
jan 1, 1989
100.0
0.0
0.0%
jan 1, 1990
100.0
0.0
0.0%
jan 1, 1991
100.0
0.0
0.0%
jan 1, 1992
100.0
0.0
0.0%
jan 1, 1993
14.624
-85.376
-85.38%
jan 1, 1994
27.396
+12.772
87.34%
jan 1, 1995
27.157
-0.239
-0.87%
jan 1, 1996
25.78
-1.377
-5.07%
jan 1, 1997
31.594
+5.814
22.55%
jan 1, 1998
19.791
-11.803
-37.36%
jan 1, 1999
12.433
-7.358
-37.18%
jan 1, 2000
8.477
-3.957
-31.82%
jan 1, 2001
15.545
+7.069
83.39%
jan 1, 2002
13.006
-2.54
-16.34%
jan 1, 2003
9.693
-3.313
-25.47%
jan 1, 2004
14.983
+5.29
54.58%
jan 1, 2005
14.163
-0.82
-5.47%
jan 1, 2006
16.02
+1.856
13.11%
jan 1, 2007
19.596
+3.576
22.32%
jan 1, 2008
28.755
+9.159
46.74%
jan 1, 2009
39.071
+10.316
35.88%
jan 1, 2010
37.73
-1.341
-3.43%
jan 1, 2011
42.538
+4.808
12.74%
jan 1, 2012
33.192
-9.346
-21.97%
jan 1, 2013
40.3
+7.108
21.42%
jan 1, 2014
30.537
-9.764
-24.23%
jan 1, 2015
32.477
+1.941
6.36%
Ranking of countries by current statistics by years


Comments: