29
/
en
AIzaSyAYiBZKx7MnpbEhh9jyipgxe19OcubqV5w
April 1, 2024
135793
Gabon
GAB
true
2
1
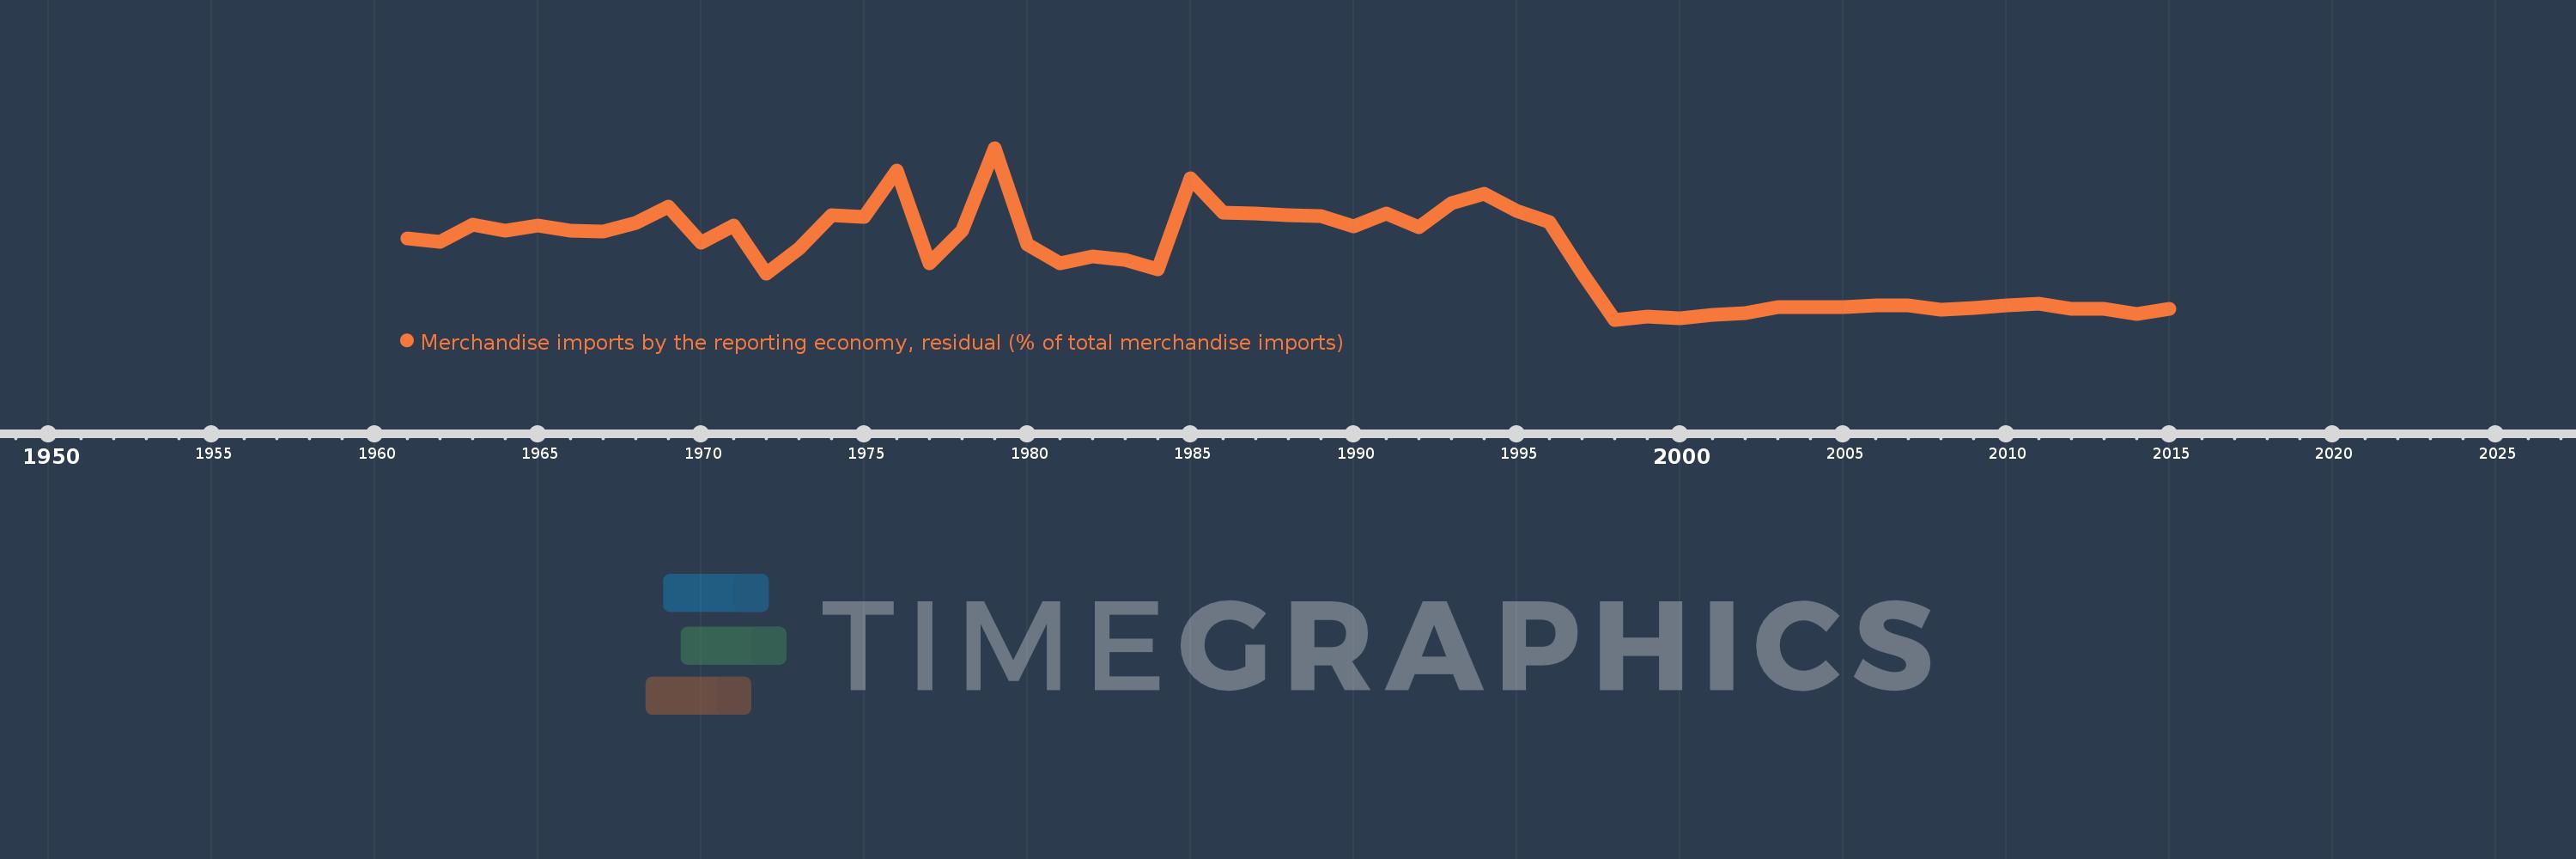
Merchandise imports by the reporting economy, residual (% of total merchandise imports)
2015,2014,2013,2012,2011,2010,2009,2008,2007,2006,2005,2004,2003,2002,2001,2000,1999,1998,1997,1996,1995,1994,1993,1992,1991,1990,1989,1988,1987,1986,1985,1984,1983,1982,1981,1980,1979,1978,1977,1976,1975,1974,1973,1972,1971,1970,1969,1968,1967,1966,1965,1964,1963,1962,1961
This statistics in other country:
AfghanistanAlbaniaAlgeriaAmerican SamoaAngolaAntigua and BarbudaArab WorldArgentinaArmeniaArubaAustraliaAustriaAzerbaijanBahamas, TheBahrainBangladeshBarbadosBelarusBelgiumBelizeBeninBermudaBoliviaBosnia and HerzegovinaBrazilBrunei DarussalamBulgariaBurkina FasoBurundiCabo VerdeCambodiaCameroonCanadaCaribbean small statesCentral African RepublicCentral Europe and the BalticsChadChileChinaColombiaComorosCongo, Dem. Rep.Congo, Rep.Costa RicaCote d'IvoireCroatiaCubaCyprusCzech RepublicDenmarkDjiboutiDominicaDominican RepublicEarly-demographic dividendEast Asia & PacificEast Asia & Pacific (excluding high income)East Asia & Pacific (IDA & IBRD countries)EcuadorEgypt, Arab Rep.El SalvadorEquatorial GuineaEstoniaEthiopiaEuro areaEurope & Central AsiaEurope & Central Asia (excluding high income)Europe & Central Asia (IDA & IBRD countries)European UnionFaroe IslandsFijiFinlandFragile and conflict affected situationsFranceFrench PolynesiaGabonGambia, TheGeorgiaGermanyGhanaGibraltarGreeceGreenlandGrenadaGuamGuatemalaGuineaGuinea-BissauGuyanaHaitiHeavily indebted poor countries (HIPC)High incomeHondurasHong Kong SAR, ChinaHungaryIBRD onlyIcelandIDA & IBRD totalIDA blendIDA onlyIDA totalIndiaIndonesiaIran, Islamic Rep.IraqIrelandIsraelItalyJamaicaJapanJordanKazakhstanKenyaKiribatiKorea, Dem. People’s Rep.Korea, Rep.KosovoKuwaitKyrgyz RepublicLao PDRLate-demographic dividendLatin America & Caribbean Latin America & Caribbean (excluding high income)Latin America & the Caribbean (IDA & IBRD countries)LatviaLeast developed countries: UN classificationLebanonLiberiaLibyaLithuaniaLow & middle incomeLow incomeLower middle incomeLuxembourgMacao SAR, ChinaMacedonia, FYRMadagascarMalawiMalaysiaMaldivesMaliMaltaMauritaniaMauritiusMexicoMiddle East & North AfricaMiddle East & North Africa (excluding high income)Middle East & North Africa (IDA & IBRD countries)Middle incomeMoldovaMongoliaMontenegroMoroccoMozambiqueMyanmarNauruNepalNetherlandsNew CaledoniaNew ZealandNicaraguaNigerNigeriaNorth AmericaNorwayOECD membersOmanOther small statesPacific island small statesPakistanPanamaPapua New GuineaParaguayPeruPhilippinesPolandPortugalPost-demographic dividendPre-demographic dividendQatarRomaniaRussian FederationRwandaSamoaSao Tome and PrincipeSaudi ArabiaSenegalSerbiaSeychellesSierra LeoneSingaporeSlovak RepublicSloveniaSmall statesSolomon IslandsSomaliaSouth AfricaSouth AsiaSouth Asia (IDA & IBRD)SpainSri LankaSt. Kitts and NevisSt. LuciaSt. Vincent and the GrenadinesSub-Saharan Africa Sub-Saharan Africa (excluding high income)Sub-Saharan Africa (IDA & IBRD countries)SudanSurinameSwedenSwitzerlandSyrian Arab RepublicTajikistanTanzaniaThailandTogoTongaTrinidad and TobagoTunisiaTurkeyTurkmenistanTuvaluUgandaUkraineUnited Arab EmiratesUnited KingdomUnited StatesUpper middle incomeUruguayUzbekistanVanuatuVenezuela, RBVietnamWorldYemen, Rep.ZambiaZimbabwe Timeline:
This timeline shows a graph from 1961 to 2015 of Gabon. No data until 1960. Number of actual observations by date: 55.
Source name:
World Development Indicators
Source organization:
World Bank staff estimates based data from International Monetary Fund's Direction of Trade database.
Categories, topics:
Private Sector, Trade
Last updated:
apr 23, 2017
Indicators value changes by year
Maximum:
15.781
jan 1, 1979
At the date of observation
Value
Absolute change
Change from previous value
jan 1, 1961
7.862
+7.862
0.0%
jan 1, 1962
7.542
-0.32
-4.07%
jan 1, 1963
9.021
+1.479
19.61%
jan 1, 1964
8.524
-0.497
-5.51%
jan 1, 1965
9.009
+0.485
5.69%
jan 1, 1966
8.507
-0.502
-5.57%
jan 1, 1967
8.434
-0.073
-0.86%
jan 1, 1968
9.185
+0.751
8.91%
jan 1, 1969
10.658
+1.473
16.04%
jan 1, 1970
7.495
-3.163
-29.68%
jan 1, 1971
8.99
+1.495
19.95%
jan 1, 1972
4.743
-4.248
-47.25%
jan 1, 1973
6.946
+2.203
46.45%
jan 1, 1974
9.891
+2.945
42.4%
jan 1, 1975
9.739
-0.152
-1.54%
jan 1, 1976
13.814
+4.076
41.85%
jan 1, 1977
5.668
-8.146
-58.97%
jan 1, 1978
8.54
+2.871
50.65%
jan 1, 1979
15.781
+7.242
84.8%
jan 1, 1980
7.351
-8.43
-53.42%
jan 1, 1981
5.696
-1.655
-22.51%
jan 1, 1982
6.25
+0.554
9.72%
jan 1, 1983
5.992
-0.258
-4.14%
jan 1, 1984
5.157
-0.835
-13.93%
jan 1, 1985
13.148
+7.991
154.96%
jan 1, 1986
10.106
-3.042
-23.13%
jan 1, 1987
9.994
-0.112
-1.11%
jan 1, 1988
9.914
-0.08
-0.8%
jan 1, 1989
9.8
-0.114
-1.15%
jan 1, 1990
8.913
-0.887
-9.05%
jan 1, 1991
10.022
+1.109
12.44%
jan 1, 1992
8.855
-1.167
-11.65%
jan 1, 1993
10.9
+2.045
23.1%
jan 1, 1994
11.743
+0.843
7.74%
jan 1, 1995
10.232
-1.511
-12.87%
jan 1, 1996
9.285
-0.947
-9.26%
jan 1, 1997
4.856
-4.429
-47.7%
jan 1, 1998
0.707
-4.149
-85.44%
jan 1, 1999
1.01
+0.304
42.94%
jan 1, 2000
0.823
-0.187
-18.51%
jan 1, 2001
1.117
+0.294
35.68%
jan 1, 2002
1.257
+0.14
12.54%
jan 1, 2003
1.811
+0.554
44.02%
jan 1, 2004
1.817
+0.006
0.31%
jan 1, 2005
1.827
+0.011
0.59%
jan 1, 2006
1.932
+0.105
5.74%
jan 1, 2007
1.944
+0.012
0.6%
jan 1, 2008
1.589
-0.355
-18.28%
jan 1, 2009
1.703
+0.114
7.21%
jan 1, 2010
1.935
+0.232
13.63%
jan 1, 2011
2.094
+0.159
8.2%
jan 1, 2012
1.684
-0.41
-19.58%
jan 1, 2013
1.676
-0.008
-0.49%
jan 1, 2014
1.224
-0.452
-26.98%
jan 1, 2015
1.671
+0.448
36.59%
Ranking of countries by current statistics by years


Comments: