29
/
en
AIzaSyAYiBZKx7MnpbEhh9jyipgxe19OcubqV5w
April 1, 2024
150671
Honduras
HND
true
2
1
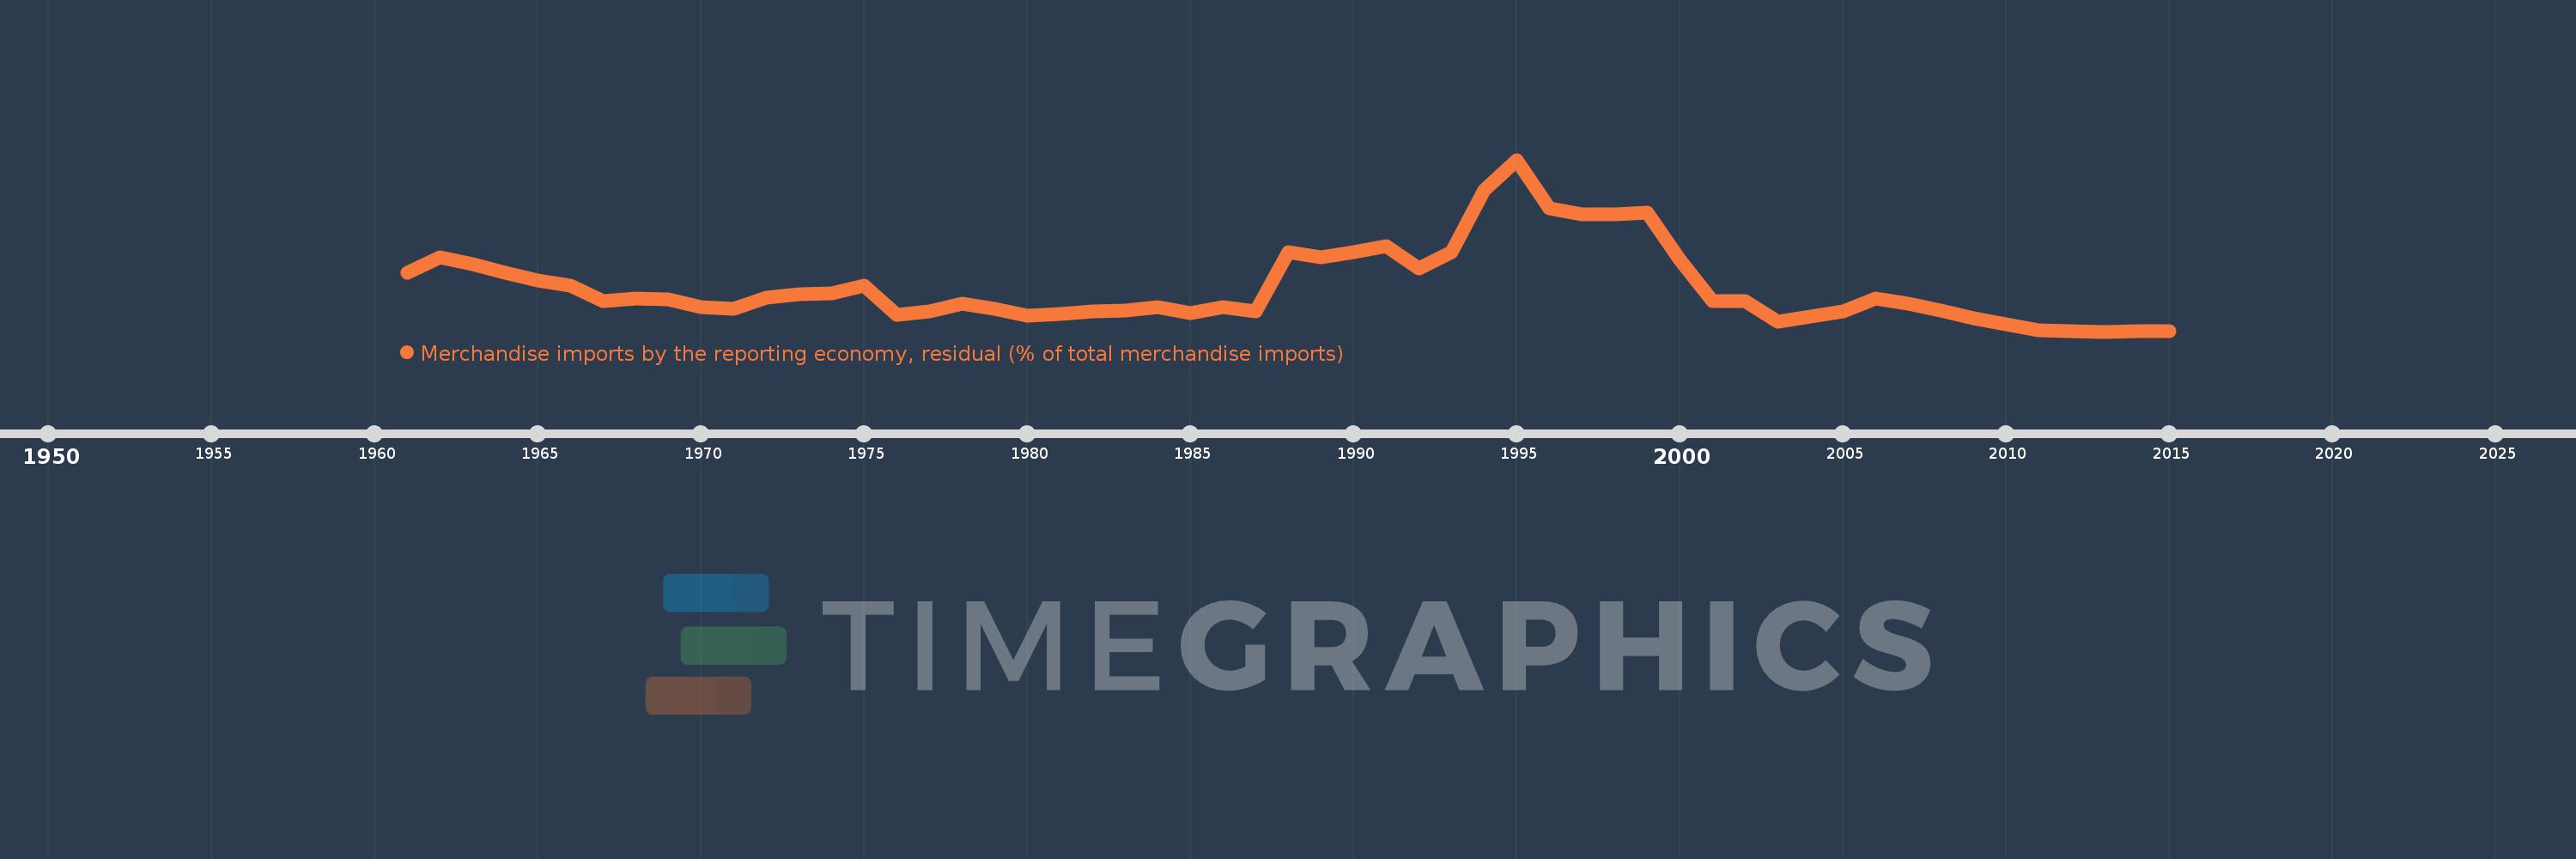
Merchandise imports by the reporting economy, residual (% of total merchandise imports)
2015,2014,2013,2012,2011,2010,2009,2008,2007,2006,2005,2004,2003,2002,2001,2000,1999,1998,1997,1996,1995,1994,1993,1992,1991,1990,1989,1988,1987,1986,1985,1984,1983,1982,1981,1980,1979,1978,1977,1976,1975,1974,1973,1972,1971,1970,1969,1968,1967,1966,1965,1964,1963,1962,1961
This statistics in other country:
AfghanistanAlbaniaAlgeriaAmerican SamoaAngolaAntigua and BarbudaArab WorldArgentinaArmeniaArubaAustraliaAustriaAzerbaijanBahamas, TheBahrainBangladeshBarbadosBelarusBelgiumBelizeBeninBermudaBoliviaBosnia and HerzegovinaBrazilBrunei DarussalamBulgariaBurkina FasoBurundiCabo VerdeCambodiaCameroonCanadaCaribbean small statesCentral African RepublicCentral Europe and the BalticsChadChileChinaColombiaComorosCongo, Dem. Rep.Congo, Rep.Costa RicaCote d'IvoireCroatiaCubaCyprusCzech RepublicDenmarkDjiboutiDominicaDominican RepublicEarly-demographic dividendEast Asia & PacificEast Asia & Pacific (excluding high income)East Asia & Pacific (IDA & IBRD countries)EcuadorEgypt, Arab Rep.El SalvadorEquatorial GuineaEstoniaEthiopiaEuro areaEurope & Central AsiaEurope & Central Asia (excluding high income)Europe & Central Asia (IDA & IBRD countries)European UnionFaroe IslandsFijiFinlandFragile and conflict affected situationsFranceFrench PolynesiaGabonGambia, TheGeorgiaGermanyGhanaGibraltarGreeceGreenlandGrenadaGuamGuatemalaGuineaGuinea-BissauGuyanaHaitiHeavily indebted poor countries (HIPC)High incomeHondurasHong Kong SAR, ChinaHungaryIBRD onlyIcelandIDA & IBRD totalIDA blendIDA onlyIDA totalIndiaIndonesiaIran, Islamic Rep.IraqIrelandIsraelItalyJamaicaJapanJordanKazakhstanKenyaKiribatiKorea, Dem. People’s Rep.Korea, Rep.KosovoKuwaitKyrgyz RepublicLao PDRLate-demographic dividendLatin America & Caribbean Latin America & Caribbean (excluding high income)Latin America & the Caribbean (IDA & IBRD countries)LatviaLeast developed countries: UN classificationLebanonLiberiaLibyaLithuaniaLow & middle incomeLow incomeLower middle incomeLuxembourgMacao SAR, ChinaMacedonia, FYRMadagascarMalawiMalaysiaMaldivesMaliMaltaMauritaniaMauritiusMexicoMiddle East & North AfricaMiddle East & North Africa (excluding high income)Middle East & North Africa (IDA & IBRD countries)Middle incomeMoldovaMongoliaMontenegroMoroccoMozambiqueMyanmarNauruNepalNetherlandsNew CaledoniaNew ZealandNicaraguaNigerNigeriaNorth AmericaNorwayOECD membersOmanOther small statesPacific island small statesPakistanPanamaPapua New GuineaParaguayPeruPhilippinesPolandPortugalPost-demographic dividendPre-demographic dividendQatarRomaniaRussian FederationRwandaSamoaSao Tome and PrincipeSaudi ArabiaSenegalSerbiaSeychellesSierra LeoneSingaporeSlovak RepublicSloveniaSmall statesSolomon IslandsSomaliaSouth AfricaSouth AsiaSouth Asia (IDA & IBRD)SpainSri LankaSt. Kitts and NevisSt. LuciaSt. Vincent and the GrenadinesSub-Saharan Africa Sub-Saharan Africa (excluding high income)Sub-Saharan Africa (IDA & IBRD countries)SudanSurinameSwedenSwitzerlandSyrian Arab RepublicTajikistanTanzaniaThailandTogoTongaTrinidad and TobagoTunisiaTurkeyTurkmenistanTuvaluUgandaUkraineUnited Arab EmiratesUnited KingdomUnited StatesUpper middle incomeUruguayUzbekistanVanuatuVenezuela, RBVietnamWorldYemen, Rep.ZambiaZimbabwe Timeline:
This timeline shows a graph from 1961 to 2015 of Honduras. No data until 1960. Number of actual observations by date: 55.
Source name:
World Development Indicators
Source organization:
World Bank staff estimates based data from International Monetary Fund's Direction of Trade database.
Categories, topics:
Private Sector, Trade
Last updated:
apr 23, 2017
Indicators value changes by year
Maximum:
23.851
jan 1, 1995
At the date of observation
Value
Absolute change
Change from previous value
jan 1, 1961
8.149
+8.149
0.0%
jan 1, 1962
10.331
+2.181
26.77%
jan 1, 1963
9.305
-1.025
-9.93%
jan 1, 1964
8.229
-1.076
-11.56%
jan 1, 1965
7.129
-1.1
-13.37%
jan 1, 1966
6.428
-0.701
-9.83%
jan 1, 1967
4.261
-2.167
-33.71%
jan 1, 1968
4.595
+0.334
7.84%
jan 1, 1969
4.519
-0.076
-1.66%
jan 1, 1970
3.365
-1.153
-25.53%
jan 1, 1971
3.16
-0.205
-6.09%
jan 1, 1972
4.702
+1.542
48.79%
jan 1, 1973
5.197
+0.495
10.53%
jan 1, 1974
5.297
+0.099
1.91%
jan 1, 1975
6.349
+1.052
19.87%
jan 1, 1976
2.279
-4.07
-64.11%
jan 1, 1977
2.862
+0.583
25.6%
jan 1, 1978
3.924
+1.062
37.1%
jan 1, 1979
3.179
-0.745
-18.99%
jan 1, 1980
2.237
-0.942
-29.64%
jan 1, 1981
2.392
+0.155
6.94%
jan 1, 1982
2.771
+0.379
15.86%
jan 1, 1983
2.946
+0.175
6.3%
jan 1, 1984
3.357
+0.412
13.98%
jan 1, 1985
2.62
-0.738
-21.97%
jan 1, 1986
3.357
+0.738
28.16%
jan 1, 1987
2.829
-0.529
-15.75%
jan 1, 1988
11.035
+8.206
290.12%
jan 1, 1989
10.262
-0.773
-7.0%
jan 1, 1990
11.031
+0.769
7.49%
jan 1, 1991
11.858
+0.827
7.5%
jan 1, 1992
8.729
-3.129
-26.39%
jan 1, 1993
11.012
+2.282
26.15%
jan 1, 1994
19.588
+8.576
77.88%
jan 1, 1995
23.851
+4.263
21.76%
jan 1, 1996
17.112
-6.739
-28.25%
jan 1, 1997
16.228
-0.884
-5.16%
jan 1, 1998
16.304
+0.075
0.46%
jan 1, 1999
16.525
+0.221
1.36%
jan 1, 2000
9.954
-6.571
-39.76%
jan 1, 2001
4.291
-5.663
-56.89%
jan 1, 2002
4.238
-0.052
-1.22%
jan 1, 2003
1.344
-2.895
-68.3%
jan 1, 2004
2.035
+0.692
51.48%
jan 1, 2005
2.794
+0.759
37.29%
jan 1, 2006
4.584
+1.79
64.04%
jan 1, 2007
3.93
-0.654
-14.26%
jan 1, 2008
2.87
-1.06
-26.98%
jan 1, 2009
1.843
-1.027
-35.78%
jan 1, 2010
1.035
-0.808
-43.84%
jan 1, 2011
0.151
-0.884
-85.38%
jan 1, 2012
0.006
-0.145
-95.9%
jan 1, 2013
0.002
-0.004
-70.87%
jan 1, 2014
0.004
+0.002
117.04%
jan 1, 2015
0.01
+0.006
147.77%
Ranking of countries by current statistics by years


Comments: