29
/
en
AIzaSyAYiBZKx7MnpbEhh9jyipgxe19OcubqV5w
April 1, 2024
218637
Panama
PAN
true
2
1
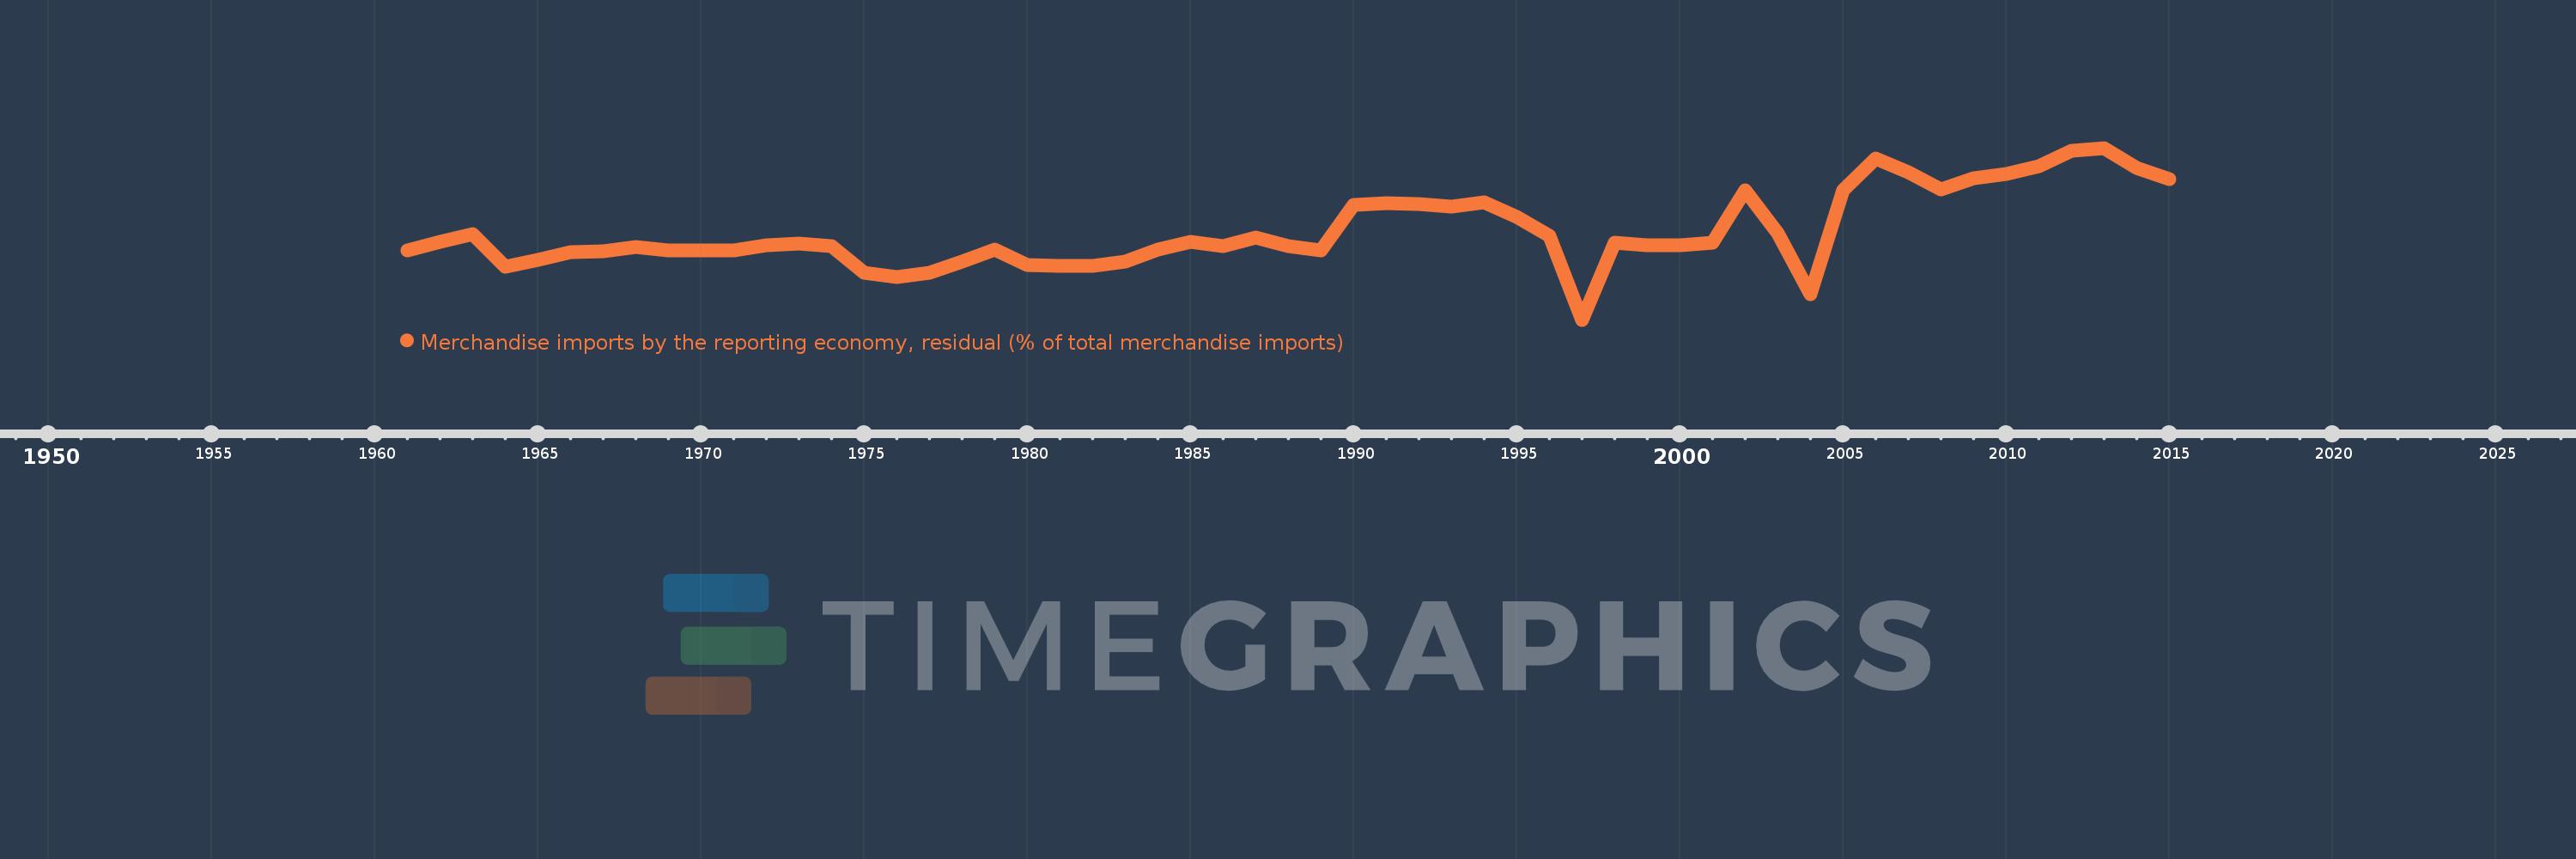
Merchandise imports by the reporting economy, residual (% of total merchandise imports)
2015,2014,2013,2012,2011,2010,2009,2008,2007,2006,2005,2004,2003,2002,2001,2000,1999,1998,1997,1996,1995,1994,1993,1992,1991,1990,1989,1988,1987,1986,1985,1984,1983,1982,1981,1980,1979,1978,1977,1976,1975,1974,1973,1972,1971,1970,1969,1968,1967,1966,1965,1964,1963,1962,1961
This statistics in other country:
AfghanistanAlbaniaAlgeriaAmerican SamoaAngolaAntigua and BarbudaArab WorldArgentinaArmeniaArubaAustraliaAustriaAzerbaijanBahamas, TheBahrainBangladeshBarbadosBelarusBelgiumBelizeBeninBermudaBoliviaBosnia and HerzegovinaBrazilBrunei DarussalamBulgariaBurkina FasoBurundiCabo VerdeCambodiaCameroonCanadaCaribbean small statesCentral African RepublicCentral Europe and the BalticsChadChileChinaColombiaComorosCongo, Dem. Rep.Congo, Rep.Costa RicaCote d'IvoireCroatiaCubaCyprusCzech RepublicDenmarkDjiboutiDominicaDominican RepublicEarly-demographic dividendEast Asia & PacificEast Asia & Pacific (excluding high income)East Asia & Pacific (IDA & IBRD countries)EcuadorEgypt, Arab Rep.El SalvadorEquatorial GuineaEstoniaEthiopiaEuro areaEurope & Central AsiaEurope & Central Asia (excluding high income)Europe & Central Asia (IDA & IBRD countries)European UnionFaroe IslandsFijiFinlandFragile and conflict affected situationsFranceFrench PolynesiaGabonGambia, TheGeorgiaGermanyGhanaGibraltarGreeceGreenlandGrenadaGuamGuatemalaGuineaGuinea-BissauGuyanaHaitiHeavily indebted poor countries (HIPC)High incomeHondurasHong Kong SAR, ChinaHungaryIBRD onlyIcelandIDA & IBRD totalIDA blendIDA onlyIDA totalIndiaIndonesiaIran, Islamic Rep.IraqIrelandIsraelItalyJamaicaJapanJordanKazakhstanKenyaKiribatiKorea, Dem. People’s Rep.Korea, Rep.KosovoKuwaitKyrgyz RepublicLao PDRLate-demographic dividendLatin America & Caribbean Latin America & Caribbean (excluding high income)Latin America & the Caribbean (IDA & IBRD countries)LatviaLeast developed countries: UN classificationLebanonLiberiaLibyaLithuaniaLow & middle incomeLow incomeLower middle incomeLuxembourgMacao SAR, ChinaMacedonia, FYRMadagascarMalawiMalaysiaMaldivesMaliMaltaMauritaniaMauritiusMexicoMiddle East & North AfricaMiddle East & North Africa (excluding high income)Middle East & North Africa (IDA & IBRD countries)Middle incomeMoldovaMongoliaMontenegroMoroccoMozambiqueMyanmarNauruNepalNetherlandsNew CaledoniaNew ZealandNicaraguaNigerNigeriaNorth AmericaNorwayOECD membersOmanOther small statesPacific island small statesPakistanPanamaPapua New GuineaParaguayPeruPhilippinesPolandPortugalPost-demographic dividendPre-demographic dividendQatarRomaniaRussian FederationRwandaSamoaSao Tome and PrincipeSaudi ArabiaSenegalSerbiaSeychellesSierra LeoneSingaporeSlovak RepublicSloveniaSmall statesSolomon IslandsSomaliaSouth AfricaSouth AsiaSouth Asia (IDA & IBRD)SpainSri LankaSt. Kitts and NevisSt. LuciaSt. Vincent and the GrenadinesSub-Saharan Africa Sub-Saharan Africa (excluding high income)Sub-Saharan Africa (IDA & IBRD countries)SudanSurinameSwedenSwitzerlandSyrian Arab RepublicTajikistanTanzaniaThailandTogoTongaTrinidad and TobagoTunisiaTurkeyTurkmenistanTuvaluUgandaUkraineUnited Arab EmiratesUnited KingdomUnited StatesUpper middle incomeUruguayUzbekistanVanuatuVenezuela, RBVietnamWorldYemen, Rep.ZambiaZimbabwe Timeline:
This timeline shows a graph from 1961 to 2015 of Panama. No data until 1960. Number of actual observations by date: 55.
Source name:
World Development Indicators
Source organization:
World Bank staff estimates based data from International Monetary Fund's Direction of Trade database.
Categories, topics:
Private Sector, Trade
Last updated:
apr 23, 2017
Indicators value changes by year
Maximum:
31.364
jan 1, 2013
At the date of observation
Value
Absolute change
Change from previous value
jan 1, 1961
13.299
+13.299
0.0%
jan 1, 1962
14.795
+1.496
11.24%
jan 1, 1963
16.25
+1.455
9.83%
jan 1, 1964
10.414
-5.836
-35.91%
jan 1, 1965
11.691
+1.277
12.26%
jan 1, 1966
12.967
+1.276
10.92%
jan 1, 1967
13.192
+0.226
1.74%
jan 1, 1968
13.969
+0.776
5.89%
jan 1, 1969
13.412
-0.557
-3.99%
jan 1, 1970
13.291
-0.12
-0.9%
jan 1, 1971
13.374
+0.082
0.62%
jan 1, 1972
14.28
+0.906
6.77%
jan 1, 1973
14.525
+0.245
1.72%
jan 1, 1974
14.137
-0.388
-2.67%
jan 1, 1975
9.425
-4.712
-33.33%
jan 1, 1976
8.604
-0.821
-8.71%
jan 1, 1977
9.412
+0.809
9.4%
jan 1, 1978
11.364
+1.952
20.73%
jan 1, 1979
13.511
+2.147
18.89%
jan 1, 1980
10.802
-2.709
-20.05%
jan 1, 1981
10.548
-0.254
-2.35%
jan 1, 1982
10.678
+0.13
1.23%
jan 1, 1983
11.373
+0.695
6.51%
jan 1, 1984
13.428
+2.055
18.07%
jan 1, 1985
14.897
+1.469
10.94%
jan 1, 1986
14.12
-0.776
-5.21%
jan 1, 1987
15.641
+1.521
10.77%
jan 1, 1988
14.123
-1.518
-9.71%
jan 1, 1989
13.373
-0.75
-5.31%
jan 1, 1990
21.301
+7.928
59.28%
jan 1, 1991
21.625
+0.325
1.52%
jan 1, 1992
21.562
-0.064
-0.3%
jan 1, 1993
21.029
-0.532
-2.47%
jan 1, 1994
21.825
+0.796
3.78%
jan 1, 1995
19.248
-2.577
-11.81%
jan 1, 1996
15.949
-3.299
-17.14%
jan 1, 1997
1.152
-14.798
-92.78%
jan 1, 1998
14.682
+13.53
1.17K%
jan 1, 1999
14.281
-0.401
-2.73%
jan 1, 2000
14.216
-0.065
-0.45%
jan 1, 2001
14.672
+0.456
3.21%
jan 1, 2002
23.887
+9.215
62.81%
jan 1, 2003
16.385
-7.502
-31.41%
jan 1, 2004
5.642
-10.743
-65.57%
jan 1, 2005
23.847
+18.205
322.67%
jan 1, 2006
29.505
+5.658
23.73%
jan 1, 2007
27.147
-2.358
-7.99%
jan 1, 2008
24.05
-3.097
-11.41%
jan 1, 2009
25.974
+1.924
8.0%
jan 1, 2010
26.719
+0.745
2.87%
jan 1, 2011
28.144
+1.425
5.33%
jan 1, 2012
30.888
+2.744
9.75%
jan 1, 2013
31.364
+0.477
1.54%
jan 1, 2014
27.782
-3.582
-11.42%
jan 1, 2015
25.91
-1.872
-6.74%
Ranking of countries by current statistics by years


Comments: