29
/
en
AIzaSyAYiBZKx7MnpbEhh9jyipgxe19OcubqV5w
April 1, 2024
79696
Barbados
BRB
true
2
1
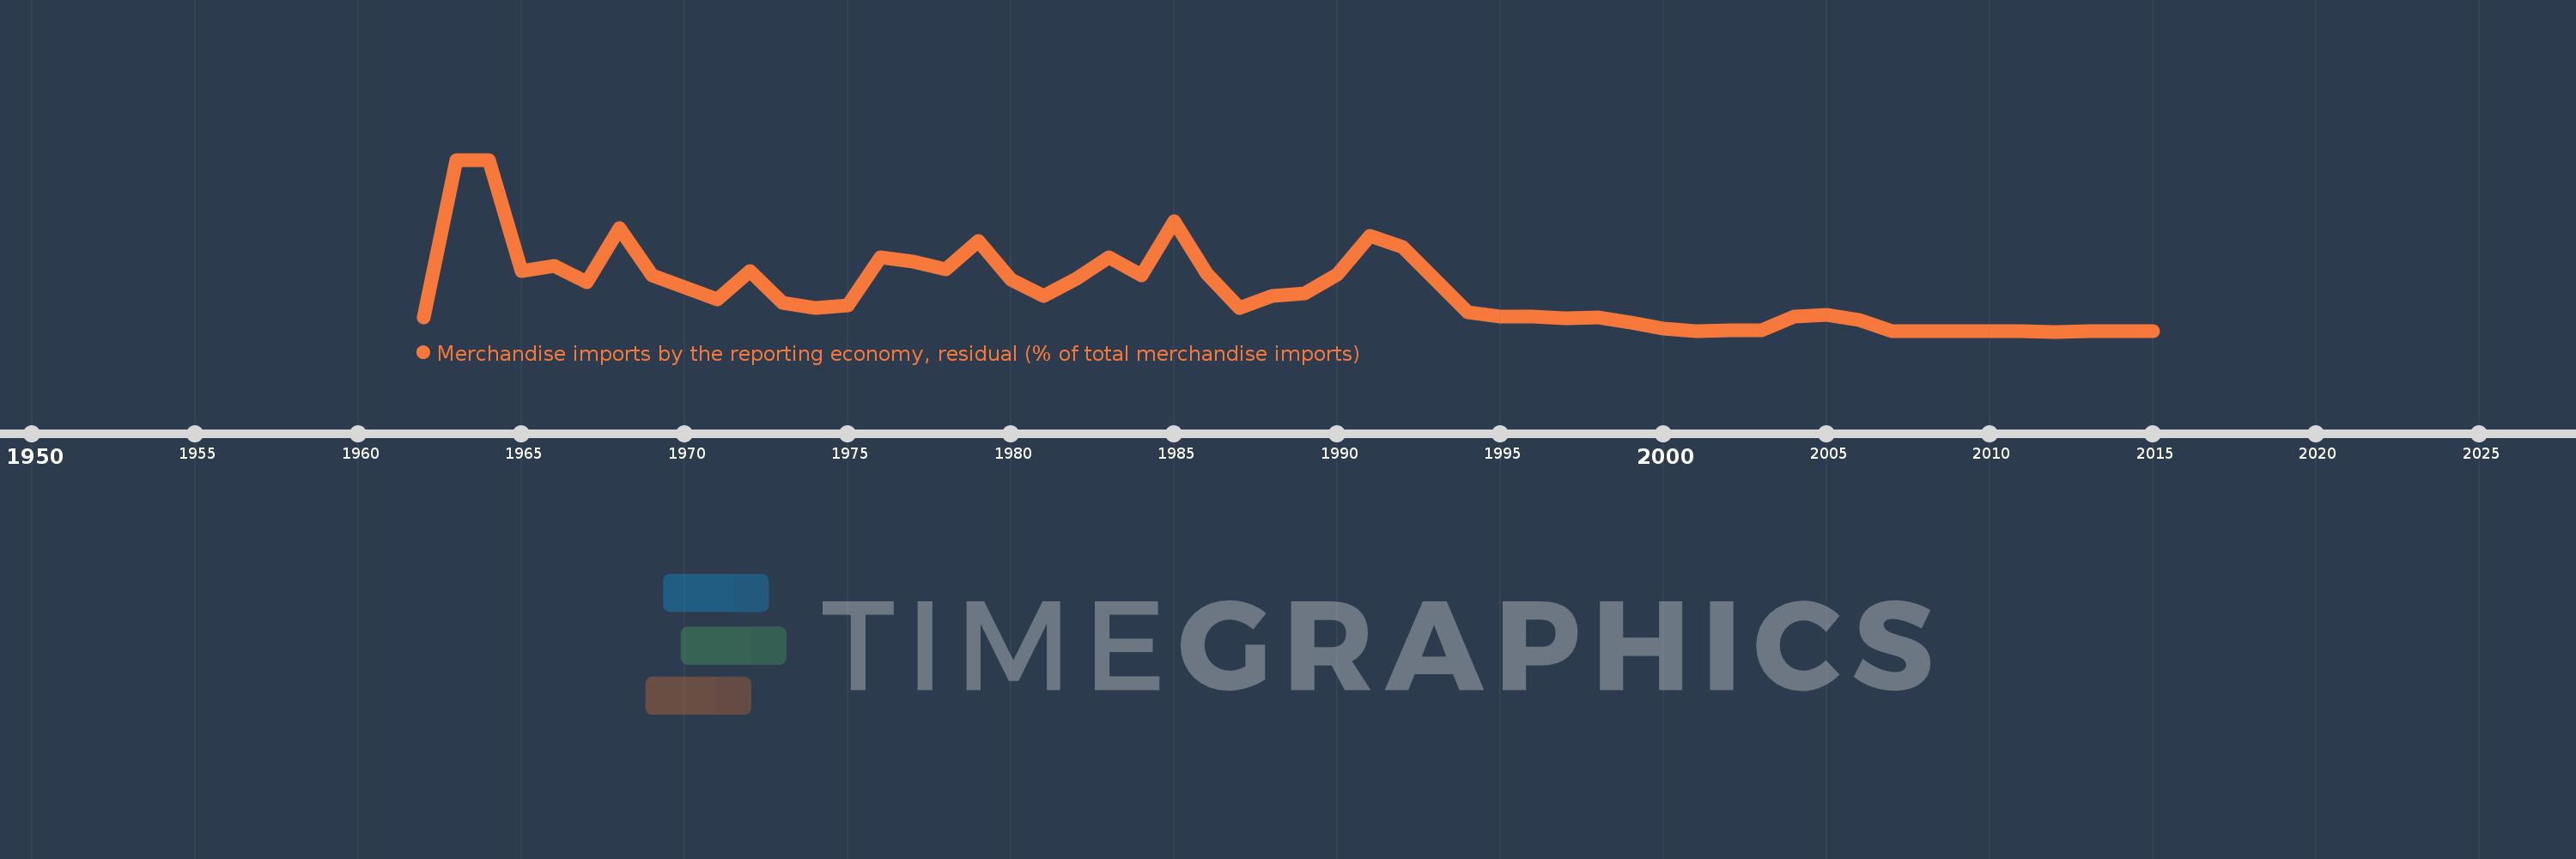
Merchandise imports by the reporting economy, residual (% of total merchandise imports)
2015,2014,2013,2012,2011,2010,2009,2008,2007,2006,2005,2004,2003,2002,2001,2000,1999,1998,1997,1996,1995,1994,1993,1992,1991,1990,1989,1988,1987,1986,1985,1984,1983,1982,1981,1980,1979,1978,1977,1976,1975,1974,1973,1972,1971,1969,1968,1967,1966,1965,1964,1963,1962
This statistics in other country:
AfghanistanAlbaniaAlgeriaAmerican SamoaAngolaAntigua and BarbudaArab WorldArgentinaArmeniaArubaAustraliaAustriaAzerbaijanBahamas, TheBahrainBangladeshBarbadosBelarusBelgiumBelizeBeninBermudaBoliviaBosnia and HerzegovinaBrazilBrunei DarussalamBulgariaBurkina FasoBurundiCabo VerdeCambodiaCameroonCanadaCaribbean small statesCentral African RepublicCentral Europe and the BalticsChadChileChinaColombiaComorosCongo, Dem. Rep.Congo, Rep.Costa RicaCote d'IvoireCroatiaCubaCyprusCzech RepublicDenmarkDjiboutiDominicaDominican RepublicEarly-demographic dividendEast Asia & PacificEast Asia & Pacific (excluding high income)East Asia & Pacific (IDA & IBRD countries)EcuadorEgypt, Arab Rep.El SalvadorEquatorial GuineaEstoniaEthiopiaEuro areaEurope & Central AsiaEurope & Central Asia (excluding high income)Europe & Central Asia (IDA & IBRD countries)European UnionFaroe IslandsFijiFinlandFragile and conflict affected situationsFranceFrench PolynesiaGabonGambia, TheGeorgiaGermanyGhanaGibraltarGreeceGreenlandGrenadaGuamGuatemalaGuineaGuinea-BissauGuyanaHaitiHeavily indebted poor countries (HIPC)High incomeHondurasHong Kong SAR, ChinaHungaryIBRD onlyIcelandIDA & IBRD totalIDA blendIDA onlyIDA totalIndiaIndonesiaIran, Islamic Rep.IraqIrelandIsraelItalyJamaicaJapanJordanKazakhstanKenyaKiribatiKorea, Dem. People’s Rep.Korea, Rep.KosovoKuwaitKyrgyz RepublicLao PDRLate-demographic dividendLatin America & Caribbean Latin America & Caribbean (excluding high income)Latin America & the Caribbean (IDA & IBRD countries)LatviaLeast developed countries: UN classificationLebanonLiberiaLibyaLithuaniaLow & middle incomeLow incomeLower middle incomeLuxembourgMacao SAR, ChinaMacedonia, FYRMadagascarMalawiMalaysiaMaldivesMaliMaltaMauritaniaMauritiusMexicoMiddle East & North AfricaMiddle East & North Africa (excluding high income)Middle East & North Africa (IDA & IBRD countries)Middle incomeMoldovaMongoliaMontenegroMoroccoMozambiqueMyanmarNauruNepalNetherlandsNew CaledoniaNew ZealandNicaraguaNigerNigeriaNorth AmericaNorwayOECD membersOmanOther small statesPacific island small statesPakistanPanamaPapua New GuineaParaguayPeruPhilippinesPolandPortugalPost-demographic dividendPre-demographic dividendQatarRomaniaRussian FederationRwandaSamoaSao Tome and PrincipeSaudi ArabiaSenegalSerbiaSeychellesSierra LeoneSingaporeSlovak RepublicSloveniaSmall statesSolomon IslandsSomaliaSouth AfricaSouth AsiaSouth Asia (IDA & IBRD)SpainSri LankaSt. Kitts and NevisSt. LuciaSt. Vincent and the GrenadinesSub-Saharan Africa Sub-Saharan Africa (excluding high income)Sub-Saharan Africa (IDA & IBRD countries)SudanSurinameSwedenSwitzerlandSyrian Arab RepublicTajikistanTanzaniaThailandTogoTongaTrinidad and TobagoTunisiaTurkeyTurkmenistanTuvaluUgandaUkraineUnited Arab EmiratesUnited KingdomUnited StatesUpper middle incomeUruguayUzbekistanVanuatuVenezuela, RBVietnamWorldYemen, Rep.ZambiaZimbabwe Timeline:
This timeline shows a graph from 1962 to 2015 of Barbados. No data until 1961. Number of actual observations by date: 53.
Source name:
World Development Indicators
Source organization:
World Bank staff estimates based data from International Monetary Fund's Direction of Trade database.
Categories, topics:
Private Sector, Trade
Last updated:
apr 23, 2017
Indicators value changes by year
Maximum:
12.016
jan 1, 1963
At the date of observation
Value
Absolute change
Change from previous value
jan 1, 1962
1.087
+1.087
0.0%
jan 1, 1963
12.016
+10.929
1.01K%
jan 1, 1964
11.979
-0.036
-0.3%
jan 1, 1965
4.293
-7.687
-64.17%
jan 1, 1966
4.641
+0.348
8.11%
jan 1, 1967
3.511
-1.13
-24.34%
jan 1, 1968
7.29
+3.779
107.63%
jan 1, 1969
3.962
-3.329
-45.66%
jan 1, 1971
2.329
-1.633
-41.21%
jan 1, 1972
4.301
+1.972
84.65%
jan 1, 1973
2.085
-2.215
-51.51%
jan 1, 1974
1.705
-0.38
-18.23%
jan 1, 1975
1.892
+0.187
10.98%
jan 1, 1976
5.268
+3.375
178.36%
jan 1, 1977
4.959
-0.308
-5.85%
jan 1, 1978
4.414
-0.545
-11.0%
jan 1, 1979
6.357
+1.944
44.03%
jan 1, 1980
3.701
-2.656
-41.78%
jan 1, 1981
2.545
-1.156
-31.24%
jan 1, 1982
3.736
+1.191
46.8%
jan 1, 1983
5.263
+1.527
40.87%
jan 1, 1984
3.97
-1.293
-24.57%
jan 1, 1985
7.731
+3.76
94.72%
jan 1, 1986
4.111
-3.62
-46.83%
jan 1, 1987
1.749
-2.362
-57.45%
jan 1, 1988
2.566
+0.817
46.71%
jan 1, 1989
2.725
+0.159
6.19%
jan 1, 1990
4.051
+1.326
48.67%
jan 1, 1991
6.751
+2.7
66.64%
jan 1, 1992
5.931
-0.82
-12.15%
jan 1, 1993
3.679
-2.252
-37.97%
jan 1, 1994
1.447
-2.232
-60.66%
jan 1, 1995
1.14
-0.308
-21.25%
jan 1, 1996
1.104
-0.036
-3.13%
jan 1, 1997
1.031
-0.073
-6.65%
jan 1, 1998
1.067
+0.036
3.48%
jan 1, 1999
0.732
-0.335
-31.37%
jan 1, 2000
0.294
-0.438
-59.85%
jan 1, 2001
0.119
-0.175
-59.53%
jan 1, 2002
0.152
+0.033
27.66%
jan 1, 2003
0.172
+0.02
13.41%
jan 1, 2004
1.145
+0.973
565.05%
jan 1, 2005
1.222
+0.077
6.7%
jan 1, 2006
0.879
-0.343
-28.06%
jan 1, 2007
0.089
-0.79
-89.91%
jan 1, 2008
0.1
+0.012
13.35%
jan 1, 2009
0.086
-0.014
-14.05%
jan 1, 2010
0.105
+0.018
21.1%
jan 1, 2011
0.097
-0.008
-7.2%
jan 1, 2012
0.083
-0.014
-14.61%
jan 1, 2013
0.12
+0.037
44.61%
jan 1, 2014
0.115
-0.005
-4.11%
jan 1, 2015
0.119
+0.004
3.91%
Ranking of countries by current statistics by years


Comments: