29
/
en
AIzaSyAYiBZKx7MnpbEhh9jyipgxe19OcubqV5w
April 1, 2024
179124
Liberia
LBR
true
2
1
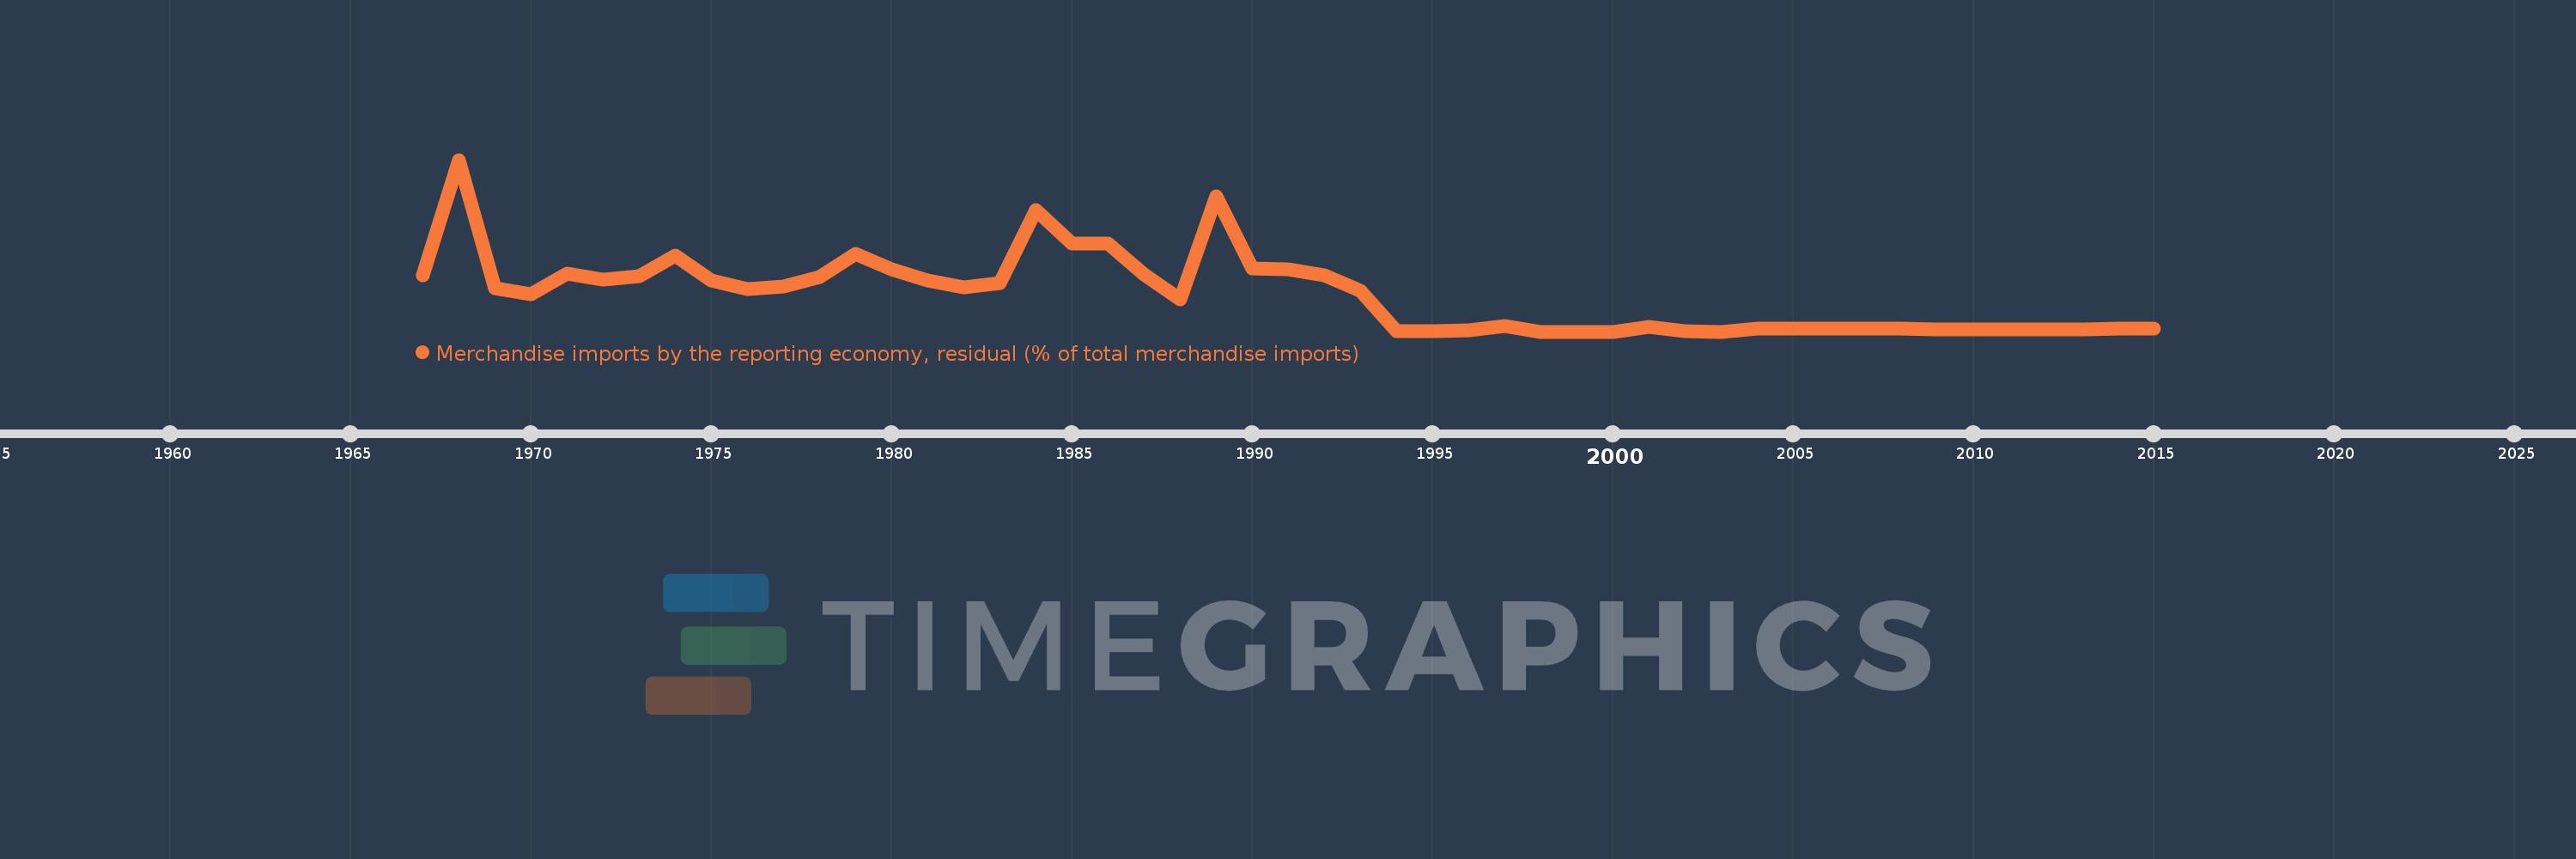
Merchandise imports by the reporting economy, residual (% of total merchandise imports)
2015,2014,2013,2012,2011,2010,2009,2008,2007,2006,2005,2004,2003,2002,2001,2000,1999,1998,1997,1996,1995,1994,1993,1992,1991,1990,1989,1988,1987,1986,1985,1984,1983,1982,1981,1980,1979,1978,1977,1976,1975,1974,1973,1972,1971,1970,1969,1968,1967
This statistics in other country:
AfghanistanAlbaniaAlgeriaAmerican SamoaAngolaAntigua and BarbudaArab WorldArgentinaArmeniaArubaAustraliaAustriaAzerbaijanBahamas, TheBahrainBangladeshBarbadosBelarusBelgiumBelizeBeninBermudaBoliviaBosnia and HerzegovinaBrazilBrunei DarussalamBulgariaBurkina FasoBurundiCabo VerdeCambodiaCameroonCanadaCaribbean small statesCentral African RepublicCentral Europe and the BalticsChadChileChinaColombiaComorosCongo, Dem. Rep.Congo, Rep.Costa RicaCote d'IvoireCroatiaCubaCyprusCzech RepublicDenmarkDjiboutiDominicaDominican RepublicEarly-demographic dividendEast Asia & PacificEast Asia & Pacific (excluding high income)East Asia & Pacific (IDA & IBRD countries)EcuadorEgypt, Arab Rep.El SalvadorEquatorial GuineaEstoniaEthiopiaEuro areaEurope & Central AsiaEurope & Central Asia (excluding high income)Europe & Central Asia (IDA & IBRD countries)European UnionFaroe IslandsFijiFinlandFragile and conflict affected situationsFranceFrench PolynesiaGabonGambia, TheGeorgiaGermanyGhanaGibraltarGreeceGreenlandGrenadaGuamGuatemalaGuineaGuinea-BissauGuyanaHaitiHeavily indebted poor countries (HIPC)High incomeHondurasHong Kong SAR, ChinaHungaryIBRD onlyIcelandIDA & IBRD totalIDA blendIDA onlyIDA totalIndiaIndonesiaIran, Islamic Rep.IraqIrelandIsraelItalyJamaicaJapanJordanKazakhstanKenyaKiribatiKorea, Dem. People’s Rep.Korea, Rep.KosovoKuwaitKyrgyz RepublicLao PDRLate-demographic dividendLatin America & Caribbean Latin America & Caribbean (excluding high income)Latin America & the Caribbean (IDA & IBRD countries)LatviaLeast developed countries: UN classificationLebanonLiberiaLibyaLithuaniaLow & middle incomeLow incomeLower middle incomeLuxembourgMacao SAR, ChinaMacedonia, FYRMadagascarMalawiMalaysiaMaldivesMaliMaltaMauritaniaMauritiusMexicoMiddle East & North AfricaMiddle East & North Africa (excluding high income)Middle East & North Africa (IDA & IBRD countries)Middle incomeMoldovaMongoliaMontenegroMoroccoMozambiqueMyanmarNauruNepalNetherlandsNew CaledoniaNew ZealandNicaraguaNigerNigeriaNorth AmericaNorwayOECD membersOmanOther small statesPacific island small statesPakistanPanamaPapua New GuineaParaguayPeruPhilippinesPolandPortugalPost-demographic dividendPre-demographic dividendQatarRomaniaRussian FederationRwandaSamoaSao Tome and PrincipeSaudi ArabiaSenegalSerbiaSeychellesSierra LeoneSingaporeSlovak RepublicSloveniaSmall statesSolomon IslandsSomaliaSouth AfricaSouth AsiaSouth Asia (IDA & IBRD)SpainSri LankaSt. Kitts and NevisSt. LuciaSt. Vincent and the GrenadinesSub-Saharan Africa Sub-Saharan Africa (excluding high income)Sub-Saharan Africa (IDA & IBRD countries)SudanSurinameSwedenSwitzerlandSyrian Arab RepublicTajikistanTanzaniaThailandTogoTongaTrinidad and TobagoTunisiaTurkeyTurkmenistanTuvaluUgandaUkraineUnited Arab EmiratesUnited KingdomUnited StatesUpper middle incomeUruguayUzbekistanVanuatuVenezuela, RBVietnamWorldYemen, Rep.ZambiaZimbabwe Timeline:
This timeline shows a graph from 1967 to 2015 of Liberia. No data until 1966. Number of actual observations by date: 49.
Source name:
World Development Indicators
Source organization:
World Bank staff estimates based data from International Monetary Fund's Direction of Trade database.
Categories, topics:
Private Sector, Trade
Last updated:
apr 23, 2017
Indicators value changes by year
Maximum:
22.796
jan 1, 1968
At the date of observation
Value
Absolute change
Change from previous value
jan 1, 1967
7.467
+7.467
0.0%
jan 1, 1968
22.796
+15.329
205.3%
jan 1, 1969
5.727
-17.069
-74.88%
jan 1, 1970
4.919
-0.808
-14.11%
jan 1, 1971
7.653
+2.734
55.58%
jan 1, 1972
6.841
-0.813
-10.62%
jan 1, 1973
7.323
+0.482
7.04%
jan 1, 1974
10.087
+2.764
37.75%
jan 1, 1975
6.753
-3.333
-33.05%
jan 1, 1976
5.682
-1.071
-15.86%
jan 1, 1977
6.034
+0.352
6.19%
jan 1, 1978
7.284
+1.25
20.71%
jan 1, 1979
10.327
+3.043
41.77%
jan 1, 1980
8.222
-2.105
-20.38%
jan 1, 1981
6.828
-1.394
-16.96%
jan 1, 1982
5.895
-0.932
-13.65%
jan 1, 1983
6.46
+0.564
9.57%
jan 1, 1984
16.075
+9.616
148.85%
jan 1, 1985
11.683
-4.393
-27.33%
jan 1, 1986
11.683
0.0
0.0%
jan 1, 1987
7.554
-4.129
-35.34%
jan 1, 1988
4.286
-3.267
-43.26%
jan 1, 1989
17.978
+13.692
319.45%
jan 1, 1990
8.379
-9.599
-53.39%
jan 1, 1991
8.288
-0.091
-1.09%
jan 1, 1992
7.434
-0.854
-10.3%
jan 1, 1993
5.428
-2.006
-26.98%
jan 1, 1994
0.089
-5.34
-98.36%
jan 1, 1995
0.056
-0.033
-37.44%
jan 1, 1996
0.114
+0.058
105.21%
jan 1, 1997
0.753
+0.639
560.06%
jan 1, 1998
0.0
-0.753
-100.0%
jan 1, 1999
0.0
+0.0
46.7%
jan 1, 2000
0.0
+0.0
237.04%
jan 1, 2001
0.577
+0.577
2.77 trl%
jan 1, 2002
0.027
-0.551
-95.38%
jan 1, 2003
0.0
-0.027
-99.77%
jan 1, 2004
0.344
+0.344
562.64K%
jan 1, 2005
0.393
+0.05
14.43%
jan 1, 2006
0.386
-0.007
-1.8%
jan 1, 2007
0.36
-0.026
-6.7%
jan 1, 2008
0.383
+0.022
6.18%
jan 1, 2009
0.328
-0.055
-14.32%
jan 1, 2010
0.261
-0.067
-20.4%
jan 1, 2011
0.244
-0.017
-6.54%
jan 1, 2012
0.248
+0.004
1.82%
jan 1, 2013
0.319
+0.071
28.62%
jan 1, 2014
0.37
+0.051
15.92%
jan 1, 2015
0.431
+0.061
16.5%
Ranking of countries by current statistics by years


Comments: