29
/
en
AIzaSyAYiBZKx7MnpbEhh9jyipgxe19OcubqV5w
April 1, 2024
258587
Syrian Arab Republic
SYR
true
2
1
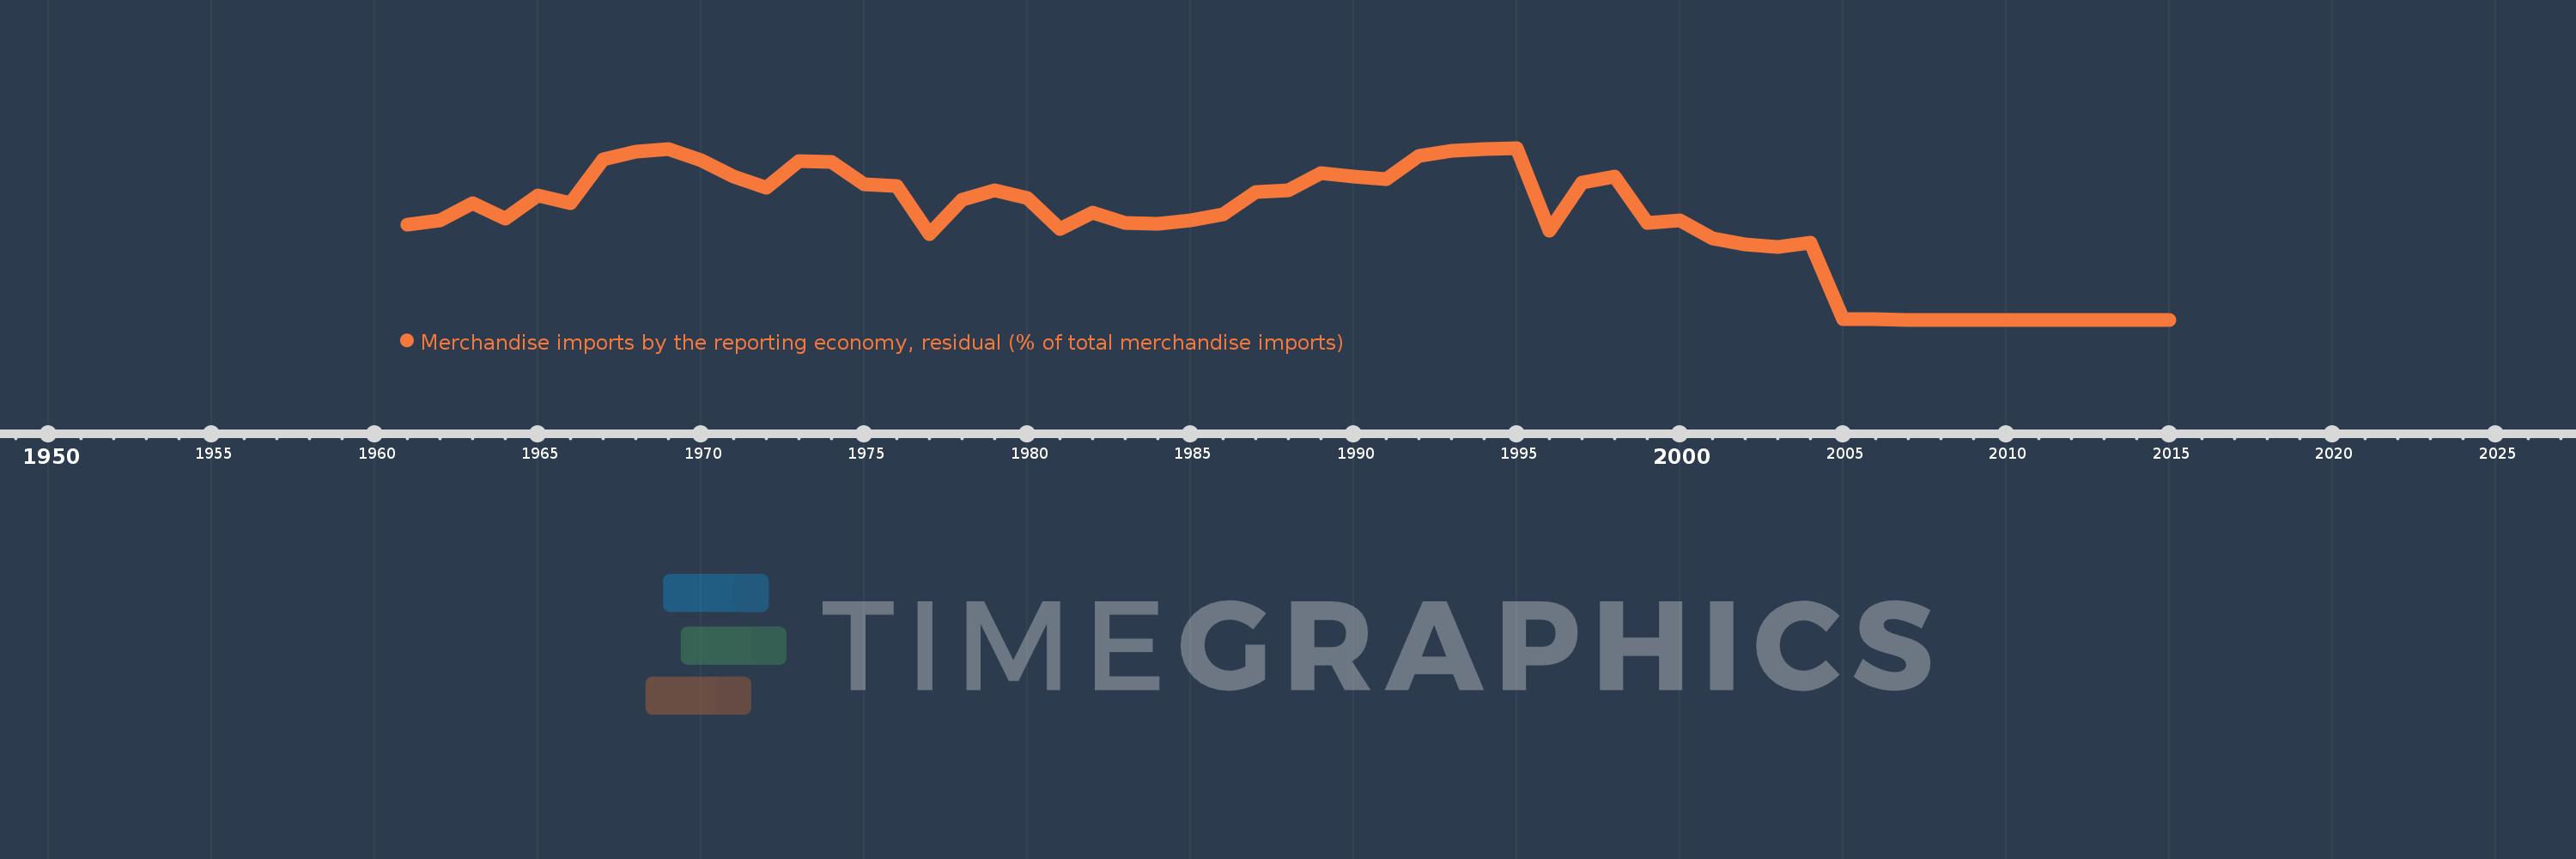
Merchandise imports by the reporting economy, residual (% of total merchandise imports)
2015,2014,2013,2012,2011,2010,2009,2008,2007,2006,2005,2004,2003,2002,2001,2000,1999,1998,1997,1996,1995,1994,1993,1992,1991,1990,1989,1988,1987,1986,1985,1984,1983,1982,1981,1980,1979,1978,1977,1976,1975,1974,1973,1972,1971,1970,1969,1968,1967,1966,1965,1964,1963,1962,1961
This statistics in other country:
AfghanistanAlbaniaAlgeriaAmerican SamoaAngolaAntigua and BarbudaArab WorldArgentinaArmeniaArubaAustraliaAustriaAzerbaijanBahamas, TheBahrainBangladeshBarbadosBelarusBelgiumBelizeBeninBermudaBoliviaBosnia and HerzegovinaBrazilBrunei DarussalamBulgariaBurkina FasoBurundiCabo VerdeCambodiaCameroonCanadaCaribbean small statesCentral African RepublicCentral Europe and the BalticsChadChileChinaColombiaComorosCongo, Dem. Rep.Congo, Rep.Costa RicaCote d'IvoireCroatiaCubaCyprusCzech RepublicDenmarkDjiboutiDominicaDominican RepublicEarly-demographic dividendEast Asia & PacificEast Asia & Pacific (excluding high income)East Asia & Pacific (IDA & IBRD countries)EcuadorEgypt, Arab Rep.El SalvadorEquatorial GuineaEstoniaEthiopiaEuro areaEurope & Central AsiaEurope & Central Asia (excluding high income)Europe & Central Asia (IDA & IBRD countries)European UnionFaroe IslandsFijiFinlandFragile and conflict affected situationsFranceFrench PolynesiaGabonGambia, TheGeorgiaGermanyGhanaGibraltarGreeceGreenlandGrenadaGuamGuatemalaGuineaGuinea-BissauGuyanaHaitiHeavily indebted poor countries (HIPC)High incomeHondurasHong Kong SAR, ChinaHungaryIBRD onlyIcelandIDA & IBRD totalIDA blendIDA onlyIDA totalIndiaIndonesiaIran, Islamic Rep.IraqIrelandIsraelItalyJamaicaJapanJordanKazakhstanKenyaKiribatiKorea, Dem. People’s Rep.Korea, Rep.KosovoKuwaitKyrgyz RepublicLao PDRLate-demographic dividendLatin America & Caribbean Latin America & Caribbean (excluding high income)Latin America & the Caribbean (IDA & IBRD countries)LatviaLeast developed countries: UN classificationLebanonLiberiaLibyaLithuaniaLow & middle incomeLow incomeLower middle incomeLuxembourgMacao SAR, ChinaMacedonia, FYRMadagascarMalawiMalaysiaMaldivesMaliMaltaMauritaniaMauritiusMexicoMiddle East & North AfricaMiddle East & North Africa (excluding high income)Middle East & North Africa (IDA & IBRD countries)Middle incomeMoldovaMongoliaMontenegroMoroccoMozambiqueMyanmarNauruNepalNetherlandsNew CaledoniaNew ZealandNicaraguaNigerNigeriaNorth AmericaNorwayOECD membersOmanOther small statesPacific island small statesPakistanPanamaPapua New GuineaParaguayPeruPhilippinesPolandPortugalPost-demographic dividendPre-demographic dividendQatarRomaniaRussian FederationRwandaSamoaSao Tome and PrincipeSaudi ArabiaSenegalSerbiaSeychellesSierra LeoneSingaporeSlovak RepublicSloveniaSmall statesSolomon IslandsSomaliaSouth AfricaSouth AsiaSouth Asia (IDA & IBRD)SpainSri LankaSt. Kitts and NevisSt. LuciaSt. Vincent and the GrenadinesSub-Saharan Africa Sub-Saharan Africa (excluding high income)Sub-Saharan Africa (IDA & IBRD countries)SudanSurinameSwedenSwitzerlandSyrian Arab RepublicTajikistanTanzaniaThailandTogoTongaTrinidad and TobagoTunisiaTurkeyTurkmenistanTuvaluUgandaUkraineUnited Arab EmiratesUnited KingdomUnited StatesUpper middle incomeUruguayUzbekistanVanuatuVenezuela, RBVietnamWorldYemen, Rep.ZambiaZimbabwe Timeline:
This timeline shows a graph from 1961 to 2015 of Syrian Arab Republic. No data until 1960. Number of actual observations by date: 55.
Source name:
World Development Indicators
Source organization:
World Bank staff estimates based data from International Monetary Fund's Direction of Trade database.
Categories, topics:
Private Sector, Trade
Last updated:
apr 23, 2017
Indicators value changes by year
Maximum:
38.931
jan 1, 1995
At the date of observation
Value
Absolute change
Change from previous value
jan 1, 1961
21.564
+21.564
0.0%
jan 1, 1962
22.476
+0.911
4.23%
jan 1, 1963
26.327
+3.851
17.13%
jan 1, 1964
22.898
-3.429
-13.02%
jan 1, 1965
28.152
+5.253
22.94%
jan 1, 1966
26.472
-1.68
-5.97%
jan 1, 1967
36.259
+9.787
36.97%
jan 1, 1968
38.097
+1.839
5.07%
jan 1, 1969
38.762
+0.665
1.75%
jan 1, 1970
36.234
-2.528
-6.52%
jan 1, 1971
32.458
-3.776
-10.42%
jan 1, 1972
29.973
-2.484
-7.65%
jan 1, 1973
35.92
+5.947
19.84%
jan 1, 1974
35.671
-0.25
-0.69%
jan 1, 1975
30.68
-4.991
-13.99%
jan 1, 1976
30.324
-0.356
-1.16%
jan 1, 1977
19.416
-10.908
-35.97%
jan 1, 1978
27.219
+7.803
40.19%
jan 1, 1979
29.253
+2.034
7.47%
jan 1, 1980
27.573
-1.68
-5.74%
jan 1, 1981
20.478
-7.095
-25.73%
jan 1, 1982
24.37
+3.892
19.0%
jan 1, 1983
21.945
-2.425
-9.95%
jan 1, 1984
21.795
-0.149
-0.68%
jan 1, 1985
22.517
+0.722
3.31%
jan 1, 1986
23.964
+1.448
6.43%
jan 1, 1987
28.987
+5.022
20.96%
jan 1, 1988
29.411
+0.425
1.46%
jan 1, 1989
33.268
+3.857
13.11%
jan 1, 1990
32.45
-0.818
-2.46%
jan 1, 1991
31.777
-0.673
-2.07%
jan 1, 1992
37.167
+5.39
16.96%
jan 1, 1993
38.255
+1.089
2.93%
jan 1, 1994
38.631
+0.376
0.98%
jan 1, 1995
38.931
+0.299
0.77%
jan 1, 1996
20.205
-18.726
-48.1%
jan 1, 1997
31.018
+10.813
53.52%
jan 1, 1998
32.409
+1.391
4.48%
jan 1, 1999
21.893
-10.516
-32.45%
jan 1, 2000
22.554
+0.661
3.02%
jan 1, 2001
18.391
-4.162
-18.45%
jan 1, 2002
17.05
-1.342
-7.3%
jan 1, 2003
16.534
-0.516
-3.02%
jan 1, 2004
17.409
+0.874
5.29%
jan 1, 2005
0.088
-17.32
-99.49%
jan 1, 2006
0.181
+0.093
105.02%
jan 1, 2007
0.0
-0.181
-100.0%
jan 1, 2008
0.0
+0.0
-179.67%
jan 1, 2009
0.0
0.0
-648.3%
jan 1, 2011
0.0
+0.0
-227.18%
jan 1, 2012
0.0
0.0
-99.98%
jan 1, 2013
0.0
0.0
-64.73 mln%
jan 1, 2014
0.0
+0.0
-30.49%
jan 1, 2015
0.0
+0.0
-242.82%
Ranking of countries by current statistics by years


Comments: