29
/
en
AIzaSyAYiBZKx7MnpbEhh9jyipgxe19OcubqV5w
April 1, 2024
252128
St. Vincent and the Grenadines
VCT
true
2
1
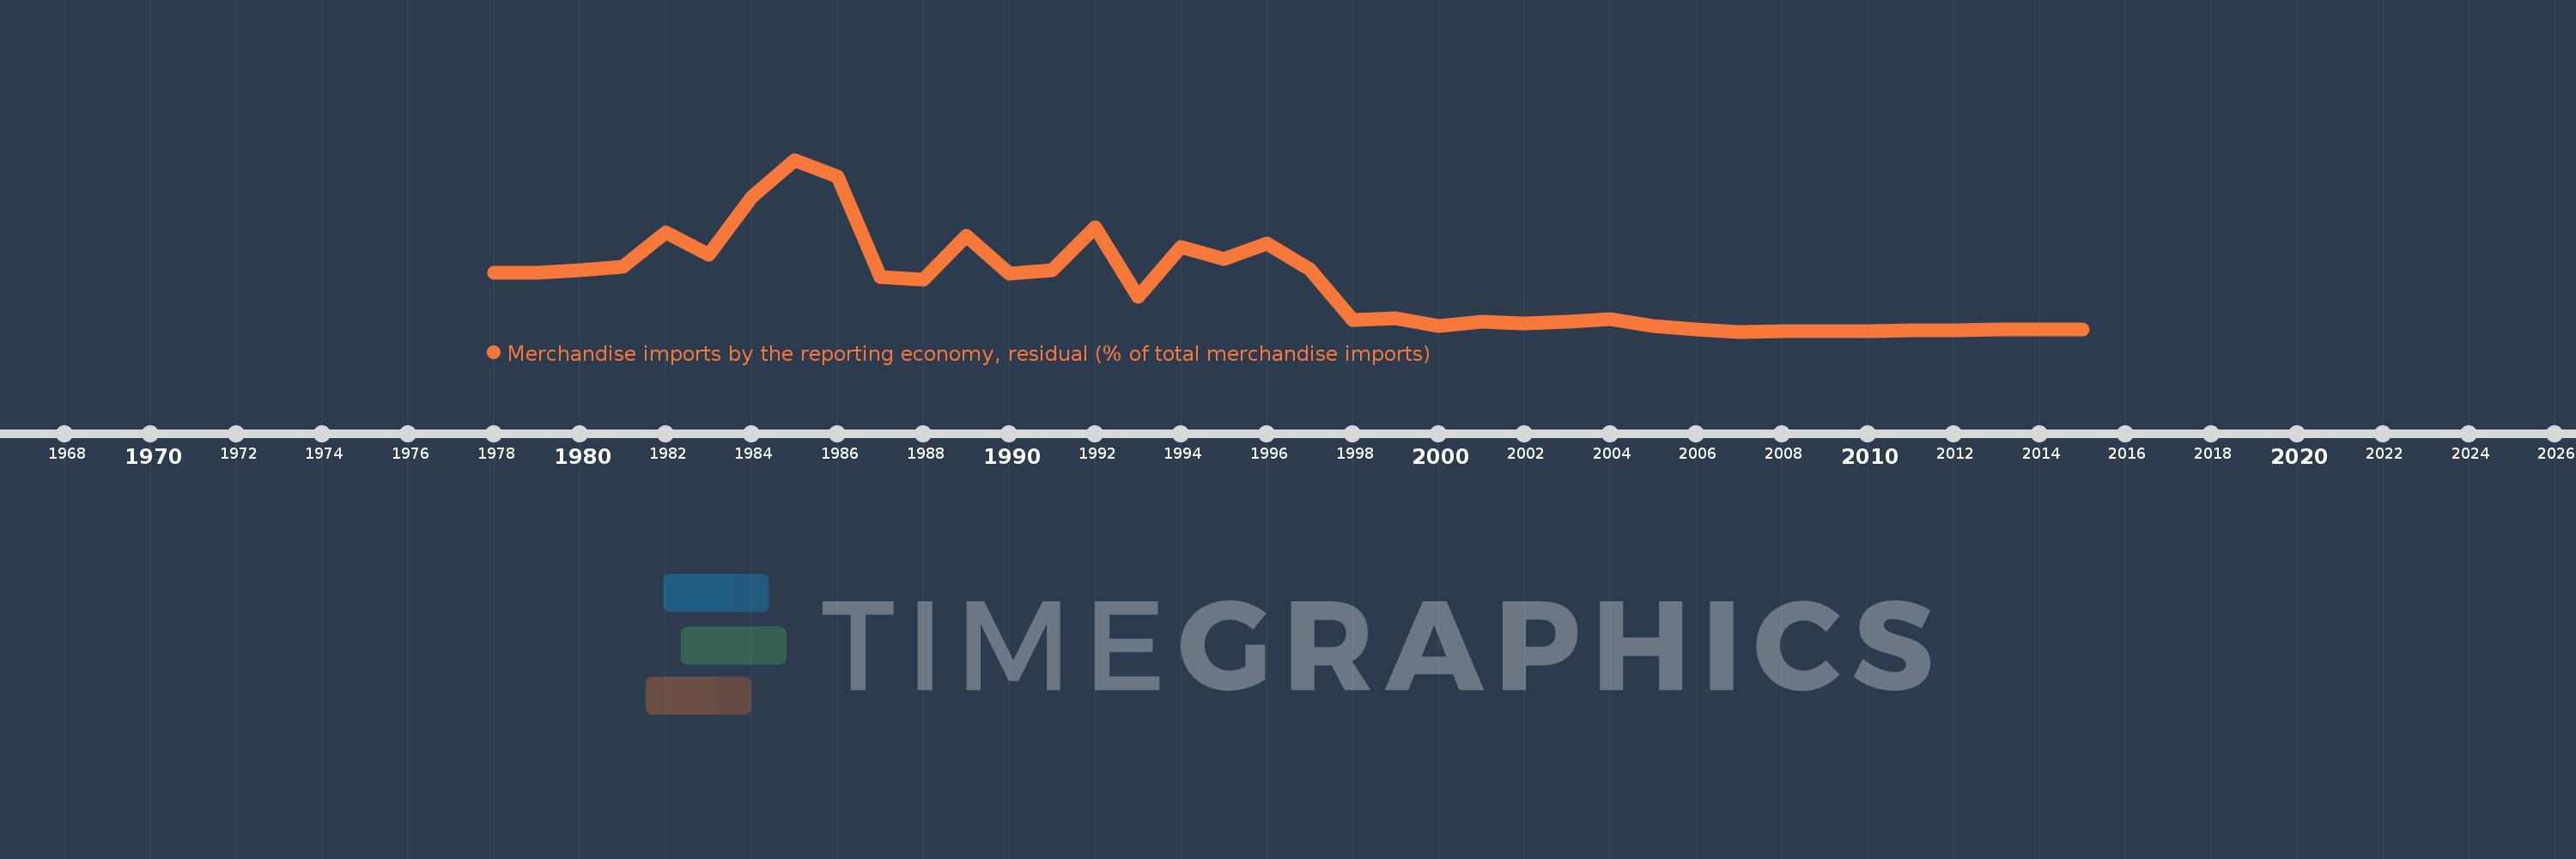
Merchandise imports by the reporting economy, residual (% of total merchandise imports)
2015,2014,2013,2012,2011,2010,2009,2008,2007,2006,2005,2004,2003,2002,2001,2000,1999,1998,1997,1996,1995,1994,1993,1992,1991,1990,1989,1988,1987,1986,1985,1984,1983,1982,1981,1980,1979,1978
This statistics in other country:
AfghanistanAlbaniaAlgeriaAmerican SamoaAngolaAntigua and BarbudaArab WorldArgentinaArmeniaArubaAustraliaAustriaAzerbaijanBahamas, TheBahrainBangladeshBarbadosBelarusBelgiumBelizeBeninBermudaBoliviaBosnia and HerzegovinaBrazilBrunei DarussalamBulgariaBurkina FasoBurundiCabo VerdeCambodiaCameroonCanadaCaribbean small statesCentral African RepublicCentral Europe and the BalticsChadChileChinaColombiaComorosCongo, Dem. Rep.Congo, Rep.Costa RicaCote d'IvoireCroatiaCubaCyprusCzech RepublicDenmarkDjiboutiDominicaDominican RepublicEarly-demographic dividendEast Asia & PacificEast Asia & Pacific (excluding high income)East Asia & Pacific (IDA & IBRD countries)EcuadorEgypt, Arab Rep.El SalvadorEquatorial GuineaEstoniaEthiopiaEuro areaEurope & Central AsiaEurope & Central Asia (excluding high income)Europe & Central Asia (IDA & IBRD countries)European UnionFaroe IslandsFijiFinlandFragile and conflict affected situationsFranceFrench PolynesiaGabonGambia, TheGeorgiaGermanyGhanaGibraltarGreeceGreenlandGrenadaGuamGuatemalaGuineaGuinea-BissauGuyanaHaitiHeavily indebted poor countries (HIPC)High incomeHondurasHong Kong SAR, ChinaHungaryIBRD onlyIcelandIDA & IBRD totalIDA blendIDA onlyIDA totalIndiaIndonesiaIran, Islamic Rep.IraqIrelandIsraelItalyJamaicaJapanJordanKazakhstanKenyaKiribatiKorea, Dem. People’s Rep.Korea, Rep.KosovoKuwaitKyrgyz RepublicLao PDRLate-demographic dividendLatin America & Caribbean Latin America & Caribbean (excluding high income)Latin America & the Caribbean (IDA & IBRD countries)LatviaLeast developed countries: UN classificationLebanonLiberiaLibyaLithuaniaLow & middle incomeLow incomeLower middle incomeLuxembourgMacao SAR, ChinaMacedonia, FYRMadagascarMalawiMalaysiaMaldivesMaliMaltaMauritaniaMauritiusMexicoMiddle East & North AfricaMiddle East & North Africa (excluding high income)Middle East & North Africa (IDA & IBRD countries)Middle incomeMoldovaMongoliaMontenegroMoroccoMozambiqueMyanmarNauruNepalNetherlandsNew CaledoniaNew ZealandNicaraguaNigerNigeriaNorth AmericaNorwayOECD membersOmanOther small statesPacific island small statesPakistanPanamaPapua New GuineaParaguayPeruPhilippinesPolandPortugalPost-demographic dividendPre-demographic dividendQatarRomaniaRussian FederationRwandaSamoaSao Tome and PrincipeSaudi ArabiaSenegalSerbiaSeychellesSierra LeoneSingaporeSlovak RepublicSloveniaSmall statesSolomon IslandsSomaliaSouth AfricaSouth AsiaSouth Asia (IDA & IBRD)SpainSri LankaSt. Kitts and NevisSt. LuciaSt. Vincent and the GrenadinesSub-Saharan Africa Sub-Saharan Africa (excluding high income)Sub-Saharan Africa (IDA & IBRD countries)SudanSurinameSwedenSwitzerlandSyrian Arab RepublicTajikistanTanzaniaThailandTogoTongaTrinidad and TobagoTunisiaTurkeyTurkmenistanTuvaluUgandaUkraineUnited Arab EmiratesUnited KingdomUnited StatesUpper middle incomeUruguayUzbekistanVanuatuVenezuela, RBVietnamWorldYemen, Rep.ZambiaZimbabwe Timeline:
This timeline shows a graph from 1978 to 2015 of St. Vincent and the Grenadines. No data until 1977. Number of actual observations by date: 38.
Source name:
World Development Indicators
Source organization:
World Bank staff estimates based data from International Monetary Fund's Direction of Trade database.
Categories, topics:
Private Sector, Trade
Last updated:
apr 23, 2017
Indicators value changes by year
At the date of observation
Value
Absolute change
Change from previous value
jan 1, 1978
2.056
+2.056
0.0%
jan 1, 1979
2.07
+0.014
0.67%
jan 1, 1980
2.15
+0.08
3.85%
jan 1, 1981
2.247
+0.097
4.51%
jan 1, 1982
3.408
+1.161
51.67%
jan 1, 1983
2.663
-0.745
-21.86%
jan 1, 1984
4.588
+1.925
72.28%
jan 1, 1985
5.84
+1.253
27.3%
jan 1, 1986
5.272
-0.568
-9.72%
jan 1, 1987
1.924
-3.348
-63.5%
jan 1, 1988
1.827
-0.097
-5.04%
jan 1, 1989
3.304
+1.477
80.81%
jan 1, 1990
2.04
-1.265
-38.27%
jan 1, 1991
2.14
+0.101
4.94%
jan 1, 1992
3.594
+1.453
67.89%
jan 1, 1993
1.242
-2.352
-65.45%
jan 1, 1994
2.913
+1.671
134.56%
jan 1, 1995
2.532
-0.381
-13.07%
jan 1, 1996
3.047
+0.516
20.36%
jan 1, 1997
2.189
-0.859
-28.18%
jan 1, 1998
0.483
-1.706
-77.95%
jan 1, 1999
0.545
+0.062
12.9%
jan 1, 2000
0.287
-0.258
-47.31%
jan 1, 2001
0.411
+0.124
43.07%
jan 1, 2002
0.354
-0.057
-13.91%
jan 1, 2003
0.411
+0.057
16.25%
jan 1, 2004
0.498
+0.087
21.25%
jan 1, 2005
0.292
-0.207
-41.49%
jan 1, 2006
0.177
-0.115
-39.39%
jan 1, 2007
0.091
-0.086
-48.65%
jan 1, 2008
0.108
+0.018
19.34%
jan 1, 2009
0.092
-0.017
-15.39%
jan 1, 2010
0.098
+0.006
6.54%
jan 1, 2011
0.123
+0.025
25.89%
jan 1, 2012
0.127
+0.004
3.3%
jan 1, 2013
0.161
+0.034
26.51%
jan 1, 2014
0.151
-0.01
-6.27%
jan 1, 2015
0.172
+0.021
14.23%
Ranking of countries by current statistics by years


Comments: