29
/
en
AIzaSyAYiBZKx7MnpbEhh9jyipgxe19OcubqV5w
April 1, 2024
29281
East Asia & Pacific (IDA & IBRD countries)
TEA
false
2
1
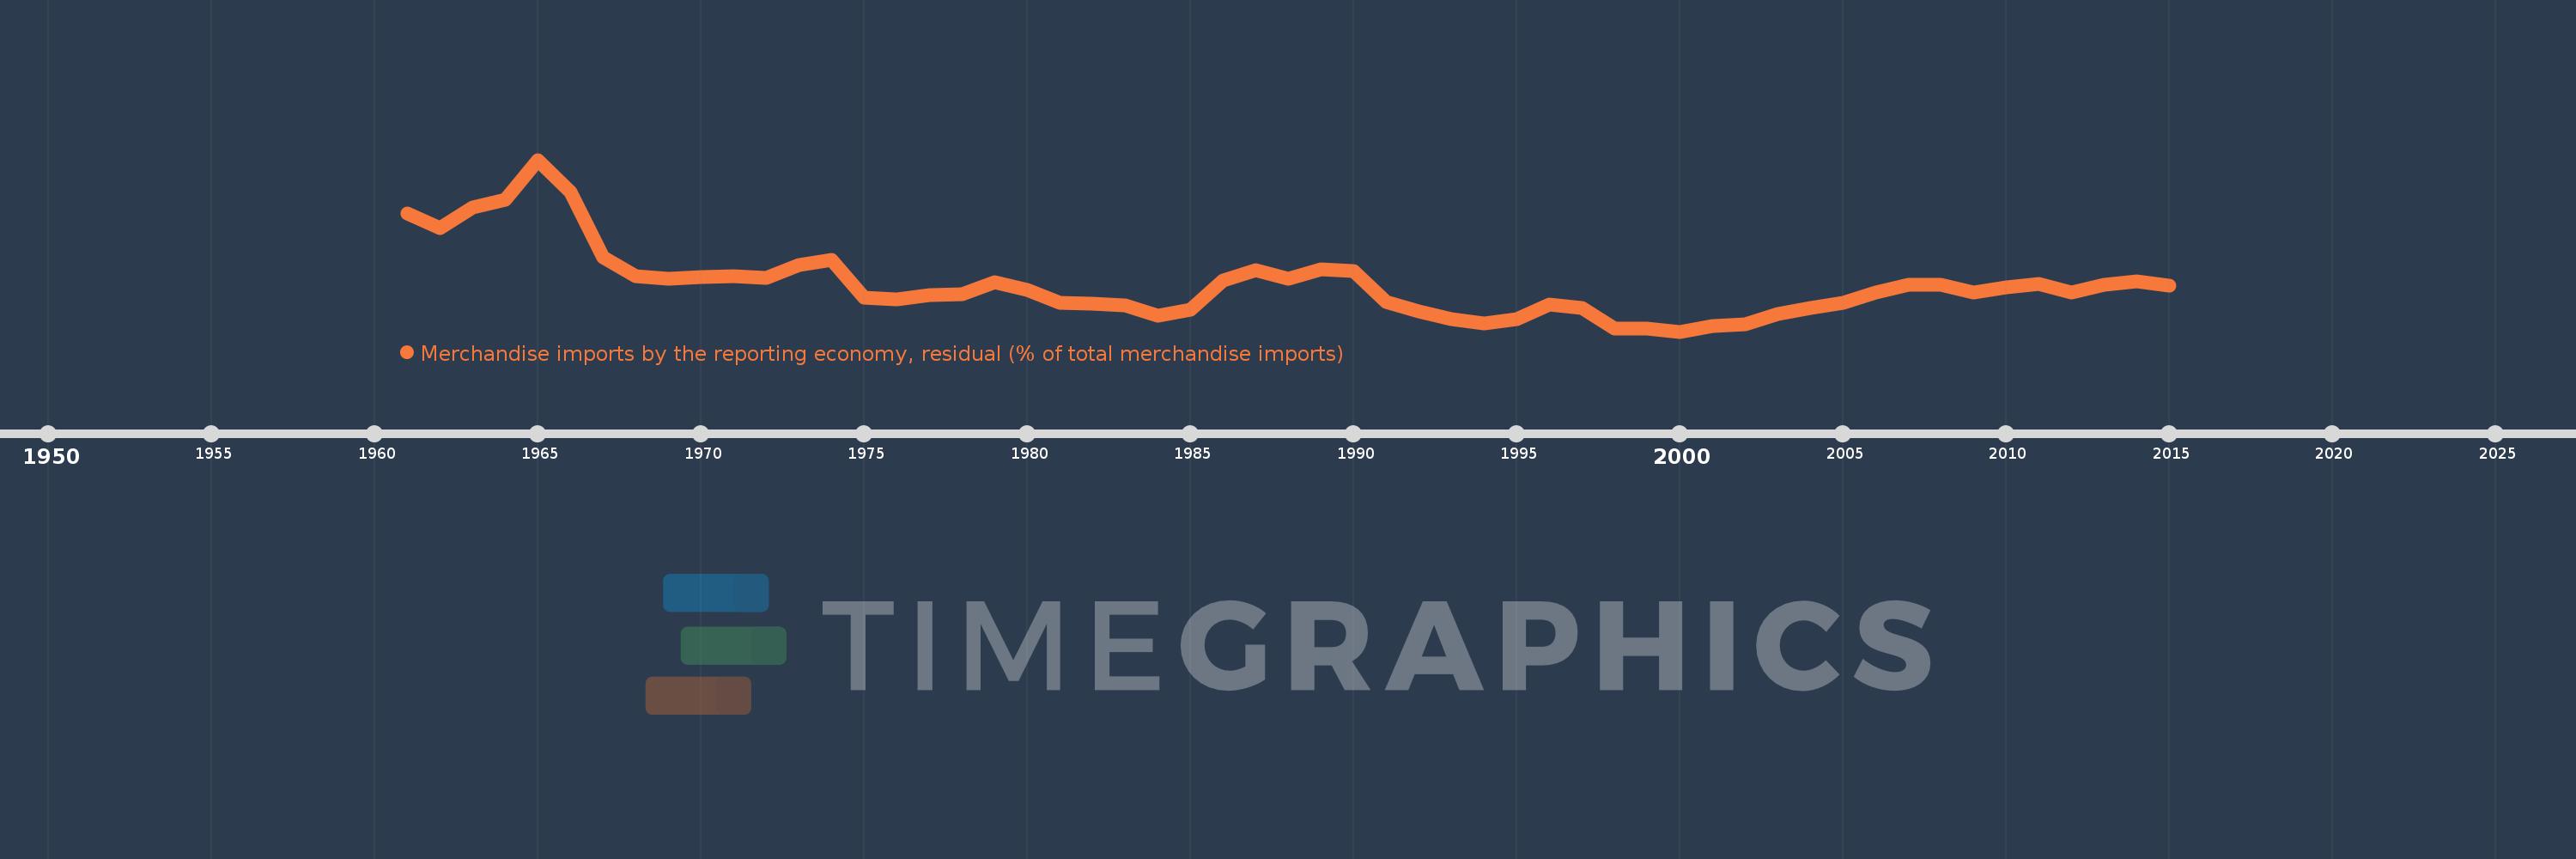
Merchandise imports by the reporting economy, residual (% of total merchandise imports)
2015,2014,2013,2012,2011,2010,2009,2008,2007,2006,2005,2004,2003,2002,2001,2000,1999,1998,1997,1996,1995,1994,1993,1992,1991,1990,1989,1988,1987,1986,1985,1984,1983,1982,1981,1980,1979,1978,1977,1976,1975,1974,1973,1972,1971,1970,1969,1968,1967,1966,1965,1964,1963,1962,1961
This statistics in other country:
AfghanistanAlbaniaAlgeriaAmerican SamoaAngolaAntigua and BarbudaArab WorldArgentinaArmeniaArubaAustraliaAustriaAzerbaijanBahamas, TheBahrainBangladeshBarbadosBelarusBelgiumBelizeBeninBermudaBoliviaBosnia and HerzegovinaBrazilBrunei DarussalamBulgariaBurkina FasoBurundiCabo VerdeCambodiaCameroonCanadaCaribbean small statesCentral African RepublicCentral Europe and the BalticsChadChileChinaColombiaComorosCongo, Dem. Rep.Congo, Rep.Costa RicaCote d'IvoireCroatiaCubaCyprusCzech RepublicDenmarkDjiboutiDominicaDominican RepublicEarly-demographic dividendEast Asia & PacificEast Asia & Pacific (excluding high income)East Asia & Pacific (IDA & IBRD countries)EcuadorEgypt, Arab Rep.El SalvadorEquatorial GuineaEstoniaEthiopiaEuro areaEurope & Central AsiaEurope & Central Asia (excluding high income)Europe & Central Asia (IDA & IBRD countries)European UnionFaroe IslandsFijiFinlandFragile and conflict affected situationsFranceFrench PolynesiaGabonGambia, TheGeorgiaGermanyGhanaGibraltarGreeceGreenlandGrenadaGuamGuatemalaGuineaGuinea-BissauGuyanaHaitiHeavily indebted poor countries (HIPC)High incomeHondurasHong Kong SAR, ChinaHungaryIBRD onlyIcelandIDA & IBRD totalIDA blendIDA onlyIDA totalIndiaIndonesiaIran, Islamic Rep.IraqIrelandIsraelItalyJamaicaJapanJordanKazakhstanKenyaKiribatiKorea, Dem. People’s Rep.Korea, Rep.KosovoKuwaitKyrgyz RepublicLao PDRLate-demographic dividendLatin America & Caribbean Latin America & Caribbean (excluding high income)Latin America & the Caribbean (IDA & IBRD countries)LatviaLeast developed countries: UN classificationLebanonLiberiaLibyaLithuaniaLow & middle incomeLow incomeLower middle incomeLuxembourgMacao SAR, ChinaMacedonia, FYRMadagascarMalawiMalaysiaMaldivesMaliMaltaMauritaniaMauritiusMexicoMiddle East & North AfricaMiddle East & North Africa (excluding high income)Middle East & North Africa (IDA & IBRD countries)Middle incomeMoldovaMongoliaMontenegroMoroccoMozambiqueMyanmarNauruNepalNetherlandsNew CaledoniaNew ZealandNicaraguaNigerNigeriaNorth AmericaNorwayOECD membersOmanOther small statesPacific island small statesPakistanPanamaPapua New GuineaParaguayPeruPhilippinesPolandPortugalPost-demographic dividendPre-demographic dividendQatarRomaniaRussian FederationRwandaSamoaSao Tome and PrincipeSaudi ArabiaSenegalSerbiaSeychellesSierra LeoneSingaporeSlovak RepublicSloveniaSmall statesSolomon IslandsSomaliaSouth AfricaSouth AsiaSouth Asia (IDA & IBRD)SpainSri LankaSt. Kitts and NevisSt. LuciaSt. Vincent and the GrenadinesSub-Saharan Africa Sub-Saharan Africa (excluding high income)Sub-Saharan Africa (IDA & IBRD countries)SudanSurinameSwedenSwitzerlandSyrian Arab RepublicTajikistanTanzaniaThailandTogoTongaTrinidad and TobagoTunisiaTurkeyTurkmenistanTuvaluUgandaUkraineUnited Arab EmiratesUnited KingdomUnited StatesUpper middle incomeUruguayUzbekistanVanuatuVenezuela, RBVietnamWorldYemen, Rep.ZambiaZimbabwe Timeline:
This timeline shows a graph from 1961 to 2015 of East Asia & Pacific (IDA & IBRD countries). No data until 1960. Number of actual observations by date: 55.
Source name:
World Development Indicators
Source organization:
World Bank staff estimates based data from International Monetary Fund's Direction of Trade database.
Categories, topics:
Private Sector, Trade
Last updated:
apr 23, 2017
Indicators value changes by year
Maximum:
17.918
jan 1, 1965
At the date of observation
Value
Absolute change
Change from previous value
jan 1, 1961
12.928
+12.928
0.0%
jan 1, 1962
11.557
-1.37
-10.6%
jan 1, 1963
13.476
+1.919
16.6%
jan 1, 1964
14.165
+0.689
5.11%
jan 1, 1965
17.918
+3.753
26.5%
jan 1, 1966
14.936
-2.982
-16.64%
jan 1, 1967
8.804
-6.132
-41.06%
jan 1, 1968
7.065
-1.739
-19.76%
jan 1, 1969
6.82
-0.244
-3.46%
jan 1, 1970
7.012
+0.192
2.81%
jan 1, 1971
7.084
+0.072
1.03%
jan 1, 1972
6.89
-0.194
-2.74%
jan 1, 1973
8.099
+1.209
17.54%
jan 1, 1974
8.588
+0.489
6.04%
jan 1, 1975
5.038
-3.549
-41.33%
jan 1, 1976
4.927
-0.111
-2.2%
jan 1, 1977
5.265
+0.337
6.84%
jan 1, 1978
5.383
+0.119
2.25%
jan 1, 1979
6.493
+1.11
20.61%
jan 1, 1980
5.803
-0.69
-10.63%
jan 1, 1981
4.579
-1.224
-21.09%
jan 1, 1982
4.493
-0.086
-1.88%
jan 1, 1983
4.331
-0.162
-3.61%
jan 1, 1984
3.406
-0.924
-21.34%
jan 1, 1985
3.904
+0.498
14.61%
jan 1, 1986
6.689
+2.785
71.34%
jan 1, 1987
7.609
+0.921
13.76%
jan 1, 1988
6.799
-0.811
-10.65%
jan 1, 1989
7.713
+0.914
13.45%
jan 1, 1990
7.541
-0.172
-2.22%
jan 1, 1991
4.67
-2.872
-38.08%
jan 1, 1992
3.792
-0.877
-18.79%
jan 1, 1993
3.036
-0.756
-19.93%
jan 1, 1994
2.693
-0.344
-11.32%
jan 1, 1995
3.054
+0.362
13.43%
jan 1, 1996
4.444
+1.39
45.49%
jan 1, 1997
4.1
-0.344
-7.73%
jan 1, 1998
2.213
-1.887
-46.03%
jan 1, 1999
2.182
-0.031
-1.4%
jan 1, 2000
1.898
-0.284
-13.03%
jan 1, 2001
2.441
+0.543
28.64%
jan 1, 2002
2.609
+0.168
6.89%
jan 1, 2003
3.513
+0.903
34.62%
jan 1, 2004
4.081
+0.568
16.17%
jan 1, 2005
4.613
+0.532
13.05%
jan 1, 2006
5.536
+0.922
19.99%
jan 1, 2007
6.293
+0.757
13.68%
jan 1, 2008
6.231
-0.062
-0.98%
jan 1, 2009
5.558
-0.673
-10.8%
jan 1, 2010
6.047
+0.489
8.8%
jan 1, 2011
6.313
+0.265
4.39%
jan 1, 2012
5.503
-0.81
-12.83%
jan 1, 2013
6.252
+0.75
13.62%
jan 1, 2014
6.552
+0.3
4.8%
jan 1, 2015
6.16
-0.392
-5.99%
Ranking of countries by current statistics by years


Comments: