29
/
en
AIzaSyAYiBZKx7MnpbEhh9jyipgxe19OcubqV5w
April 1, 2024
186789
Malawi
MWI
true
2
1
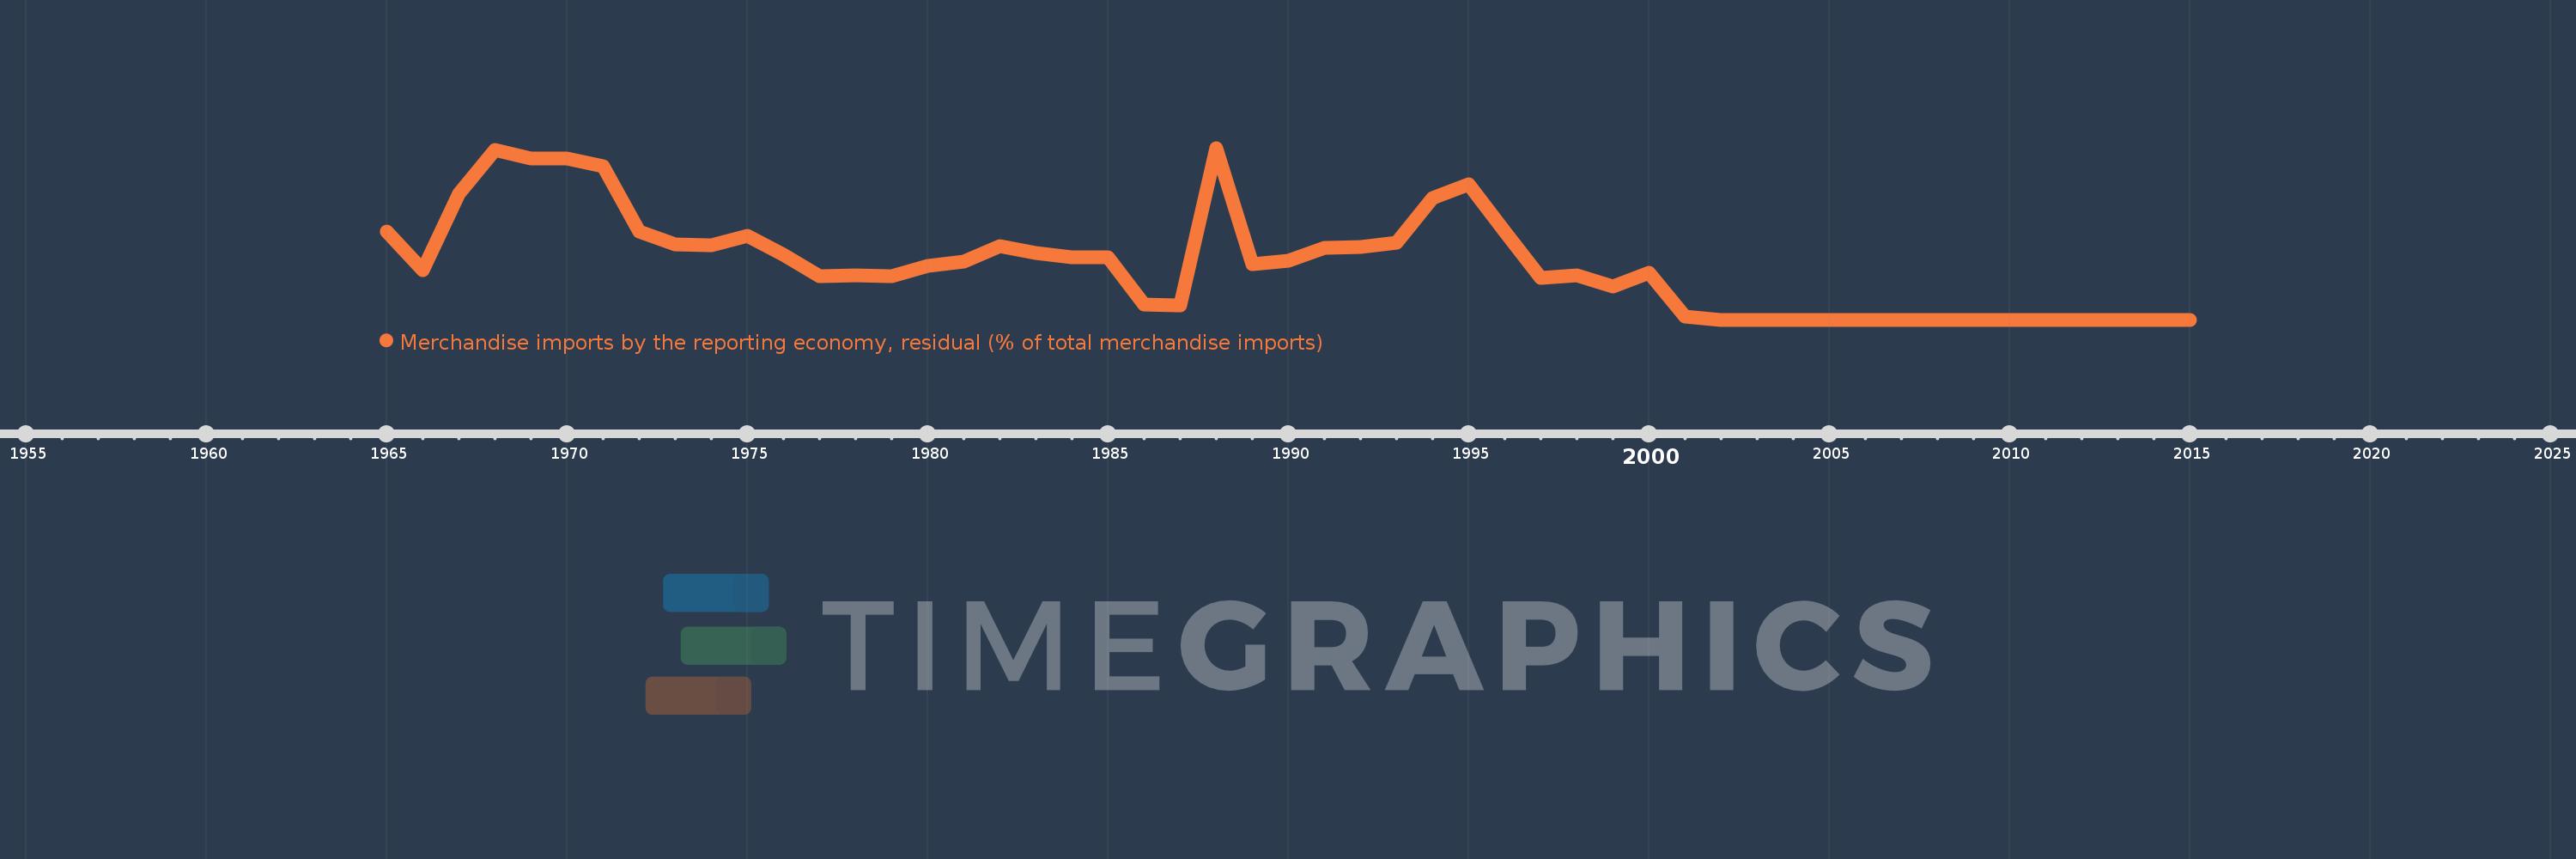
Merchandise imports by the reporting economy, residual (% of total merchandise imports)
2015,2014,2013,2012,2011,2010,2009,2008,2007,2006,2005,2004,2003,2002,2001,2000,1999,1998,1997,1996,1995,1994,1993,1992,1991,1990,1989,1988,1987,1986,1985,1984,1983,1982,1981,1980,1979,1978,1977,1976,1975,1974,1973,1972,1971,1970,1969,1968,1967,1966,1965
This statistics in other country:
AfghanistanAlbaniaAlgeriaAmerican SamoaAngolaAntigua and BarbudaArab WorldArgentinaArmeniaArubaAustraliaAustriaAzerbaijanBahamas, TheBahrainBangladeshBarbadosBelarusBelgiumBelizeBeninBermudaBoliviaBosnia and HerzegovinaBrazilBrunei DarussalamBulgariaBurkina FasoBurundiCabo VerdeCambodiaCameroonCanadaCaribbean small statesCentral African RepublicCentral Europe and the BalticsChadChileChinaColombiaComorosCongo, Dem. Rep.Congo, Rep.Costa RicaCote d'IvoireCroatiaCubaCyprusCzech RepublicDenmarkDjiboutiDominicaDominican RepublicEarly-demographic dividendEast Asia & PacificEast Asia & Pacific (excluding high income)East Asia & Pacific (IDA & IBRD countries)EcuadorEgypt, Arab Rep.El SalvadorEquatorial GuineaEstoniaEthiopiaEuro areaEurope & Central AsiaEurope & Central Asia (excluding high income)Europe & Central Asia (IDA & IBRD countries)European UnionFaroe IslandsFijiFinlandFragile and conflict affected situationsFranceFrench PolynesiaGabonGambia, TheGeorgiaGermanyGhanaGibraltarGreeceGreenlandGrenadaGuamGuatemalaGuineaGuinea-BissauGuyanaHaitiHeavily indebted poor countries (HIPC)High incomeHondurasHong Kong SAR, ChinaHungaryIBRD onlyIcelandIDA & IBRD totalIDA blendIDA onlyIDA totalIndiaIndonesiaIran, Islamic Rep.IraqIrelandIsraelItalyJamaicaJapanJordanKazakhstanKenyaKiribatiKorea, Dem. People’s Rep.Korea, Rep.KosovoKuwaitKyrgyz RepublicLao PDRLate-demographic dividendLatin America & Caribbean Latin America & Caribbean (excluding high income)Latin America & the Caribbean (IDA & IBRD countries)LatviaLeast developed countries: UN classificationLebanonLiberiaLibyaLithuaniaLow & middle incomeLow incomeLower middle incomeLuxembourgMacao SAR, ChinaMacedonia, FYRMadagascarMalawiMalaysiaMaldivesMaliMaltaMauritaniaMauritiusMexicoMiddle East & North AfricaMiddle East & North Africa (excluding high income)Middle East & North Africa (IDA & IBRD countries)Middle incomeMoldovaMongoliaMontenegroMoroccoMozambiqueMyanmarNauruNepalNetherlandsNew CaledoniaNew ZealandNicaraguaNigerNigeriaNorth AmericaNorwayOECD membersOmanOther small statesPacific island small statesPakistanPanamaPapua New GuineaParaguayPeruPhilippinesPolandPortugalPost-demographic dividendPre-demographic dividendQatarRomaniaRussian FederationRwandaSamoaSao Tome and PrincipeSaudi ArabiaSenegalSerbiaSeychellesSierra LeoneSingaporeSlovak RepublicSloveniaSmall statesSolomon IslandsSomaliaSouth AfricaSouth AsiaSouth Asia (IDA & IBRD)SpainSri LankaSt. Kitts and NevisSt. LuciaSt. Vincent and the GrenadinesSub-Saharan Africa Sub-Saharan Africa (excluding high income)Sub-Saharan Africa (IDA & IBRD countries)SudanSurinameSwedenSwitzerlandSyrian Arab RepublicTajikistanTanzaniaThailandTogoTongaTrinidad and TobagoTunisiaTurkeyTurkmenistanTuvaluUgandaUkraineUnited Arab EmiratesUnited KingdomUnited StatesUpper middle incomeUruguayUzbekistanVanuatuVenezuela, RBVietnamWorldYemen, Rep.ZambiaZimbabwe Timeline:
This timeline shows a graph from 1965 to 2015 of Malawi. No data until 1964. Number of actual observations by date: 51.
Source name:
World Development Indicators
Source organization:
World Bank staff estimates based data from International Monetary Fund's Direction of Trade database.
Categories, topics:
Private Sector, Trade
Last updated:
apr 23, 2017
Indicators value changes by year
Maximum:
20.326
jan 1, 1988
At the date of observation
Value
Absolute change
Change from previous value
jan 1, 1965
10.437
+10.437
0.0%
jan 1, 1966
5.854
-4.583
-43.91%
jan 1, 1967
14.883
+9.028
154.23%
jan 1, 1968
20.076
+5.194
34.9%
jan 1, 1969
19.061
-1.015
-5.06%
jan 1, 1970
19.065
+0.004
0.02%
jan 1, 1971
18.161
-0.904
-4.74%
jan 1, 1972
10.468
-7.693
-42.36%
jan 1, 1973
8.962
-1.506
-14.39%
jan 1, 1974
8.787
-0.176
-1.96%
jan 1, 1975
9.96
+1.174
13.36%
jan 1, 1976
7.746
-2.214
-22.23%
jan 1, 1977
5.179
-2.567
-33.15%
jan 1, 1978
5.296
+0.118
2.28%
jan 1, 1979
5.135
-0.161
-3.04%
jan 1, 1980
6.42
+1.285
25.02%
jan 1, 1981
6.886
+0.466
7.26%
jan 1, 1982
8.67
+1.784
25.9%
jan 1, 1983
7.873
-0.797
-9.2%
jan 1, 1984
7.435
-0.438
-5.56%
jan 1, 1985
7.438
+0.003
0.05%
jan 1, 1986
1.773
-5.665
-76.16%
jan 1, 1987
1.718
-0.056
-3.13%
jan 1, 1988
20.326
+18.608
1.08K%
jan 1, 1989
6.591
-13.734
-67.57%
jan 1, 1990
6.969
+0.378
5.73%
jan 1, 1991
8.507
+1.538
22.08%
jan 1, 1992
8.579
+0.071
0.84%
jan 1, 1993
9.118
+0.539
6.28%
jan 1, 1994
14.432
+5.314
58.28%
jan 1, 1995
15.996
+1.565
10.84%
jan 1, 1996
10.447
-5.549
-34.69%
jan 1, 1997
4.958
-5.489
-52.54%
jan 1, 1998
5.249
+0.29
5.86%
jan 1, 1999
3.939
-1.31
-24.96%
jan 1, 2000
5.6
+1.661
42.18%
jan 1, 2001
0.345
-5.255
-93.85%
jan 1, 2002
0.011
-0.334
-96.84%
jan 1, 2003
0.008
-0.003
-24.15%
jan 1, 2004
0.01
+0.001
16.39%
jan 1, 2005
0.009
-0.001
-8.59%
jan 1, 2006
0.01
+0.001
10.73%
jan 1, 2007
0.011
+0.001
10.35%
jan 1, 2008
0.011
+0.0
2.26%
jan 1, 2009
0.009
-0.002
-22.52%
jan 1, 2010
0.008
-0.001
-7.67%
jan 1, 2011
0.009
+0.001
16.68%
jan 1, 2012
0.009
0.0
-0.18%
jan 1, 2013
0.008
-0.001
-15.58%
jan 1, 2014
0.007
0.0
-3.36%
jan 1, 2015
0.009
+0.001
16.08%
Ranking of countries by current statistics by years


Comments: