29
/
en
AIzaSyAYiBZKx7MnpbEhh9jyipgxe19OcubqV5w
April 1, 2024
92436
Brunei Darussalam
BRN
true
2
1
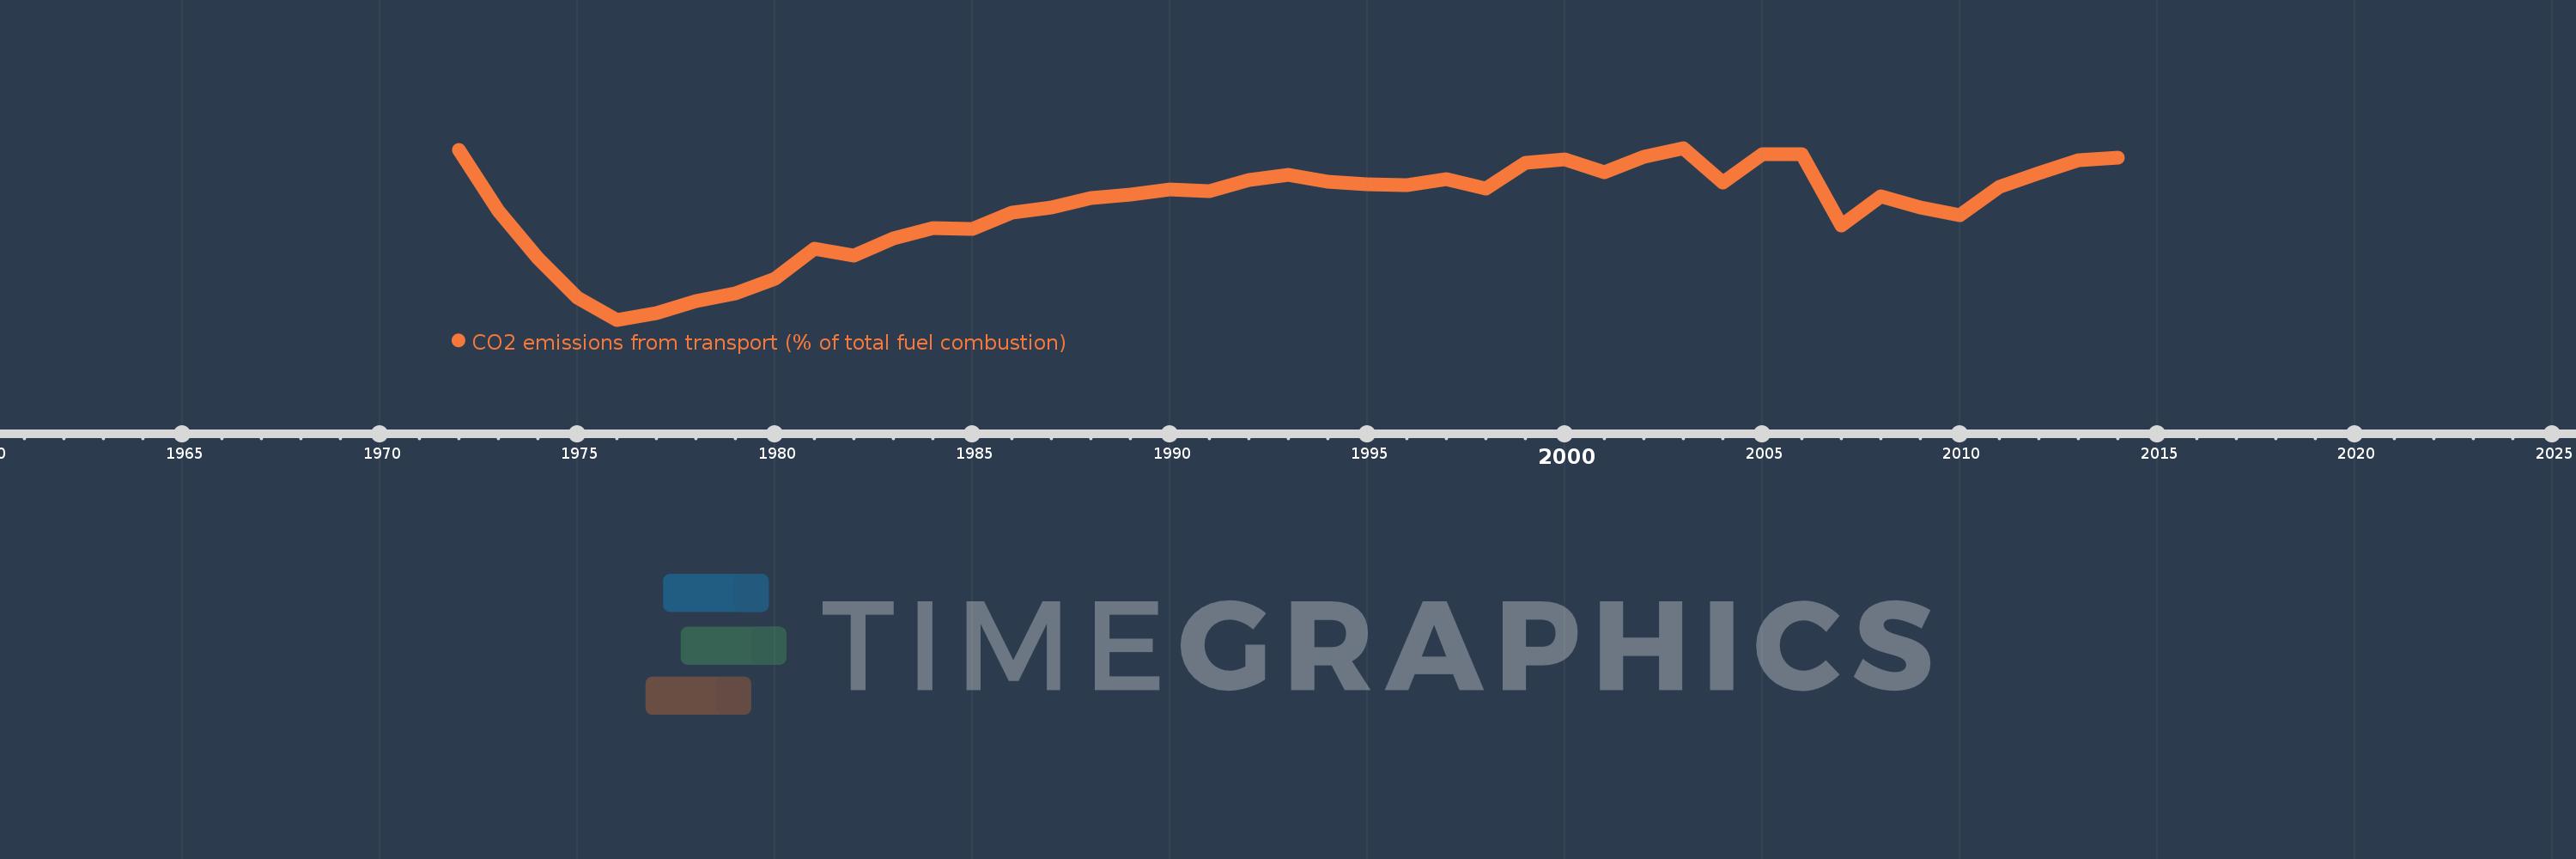
CO2 emissions from transport (% of total fuel combustion)
2014,2013,2012,2011,2010,2009,2008,2007,2006,2005,2004,2003,2002,2001,2000,1999,1998,1997,1996,1995,1994,1993,1992,1991,1990,1989,1988,1987,1986,1985,1984,1983,1982,1981,1980,1979,1978,1977,1976,1975,1974,1973,1972
This statistics in other country:
AlbaniaAlgeriaAngolaArab WorldArgentinaArmeniaAustraliaAustriaAzerbaijanBahrainBangladeshBelarusBelgiumBeninBoliviaBosnia and HerzegovinaBotswanaBrazilBrunei DarussalamBulgariaCambodiaCameroonCanadaCaribbean small statesCentral Europe and the BalticsChileChinaColombiaCongo, Dem. Rep.Congo, Rep.Costa RicaCote d'IvoireCroatiaCubaCuracaoCyprusCzech RepublicDenmarkDominican RepublicEarly-demographic dividendEast Asia & PacificEast Asia & Pacific (excluding high income)East Asia & Pacific (IDA & IBRD countries)EcuadorEgypt, Arab Rep.El SalvadorEritreaEstoniaEthiopiaEuro areaEurope & Central AsiaEurope & Central Asia (excluding high income)Europe & Central Asia (IDA & IBRD countries)European UnionFinlandFragile and conflict affected situationsFranceGabonGeorgiaGermanyGhanaGibraltarGreeceGuatemalaHaitiHeavily indebted poor countries (HIPC)High incomeHondurasHong Kong SAR, ChinaHungaryIBRD onlyIcelandIDA & IBRD totalIDA blendIDA onlyIDA totalIndiaIndonesiaIran, Islamic Rep.IraqIrelandIsraelItalyJamaicaJapanJordanKazakhstanKenyaKorea, Dem. People’s Rep.Korea, Rep.KosovoKuwaitKyrgyz RepublicLate-demographic dividendLatin America & Caribbean Latin America & Caribbean (excluding high income)Latin America & the Caribbean (IDA & IBRD countries)LatviaLeast developed countries: UN classificationLebanonLibyaLithuaniaLow & middle incomeLow incomeLower middle incomeLuxembourgMacedonia, FYRMalaysiaMaltaMauritiusMexicoMiddle East & North AfricaMiddle East & North Africa (excluding high income)Middle East & North Africa (IDA & IBRD countries)Middle incomeMoldovaMongoliaMontenegroMoroccoMozambiqueMyanmarNamibiaNepalNetherlandsNew ZealandNicaraguaNigerNigeriaNorth AmericaNorwayOECD membersOmanOther small statesPakistanPanamaParaguayPeruPhilippinesPolandPortugalPost-demographic dividendPre-demographic dividendQatarRomaniaRussian FederationSaudi ArabiaSenegalSerbiaSingaporeSlovak RepublicSloveniaSmall statesSouth AfricaSouth AsiaSouth Asia (IDA & IBRD)South SudanSpainSri LankaSub-Saharan Africa Sub-Saharan Africa (excluding high income)Sub-Saharan Africa (IDA & IBRD countries)SudanSwedenSwitzerlandSyrian Arab RepublicTajikistanTanzaniaThailandTogoTrinidad and TobagoTunisiaTurkeyTurkmenistanUkraineUnited Arab EmiratesUnited KingdomUnited StatesUpper middle incomeUruguayUzbekistanVenezuela, RBVietnamWorldYemen, Rep.ZambiaZimbabwe Timeline:
This timeline shows a graph from 1972 to 2014 of Brunei Darussalam. No data until 1971. Number of actual observations by date: 43.
Source name:
World Development Indicators
Source organization:
IEA Statistics © OECD/IEA 2014 (http://www.iea.org/stats/index.asp), subject to https://www.iea.org/t&c/termsandconditions/
Categories, topics:
Environment
Last updated:
apr 23, 2017
Indicators value changes by year
Maximum:
20.183
jan 1, 2003
At the date of observation
Value
Absolute change
Change from previous value
jan 1, 1972
20.0
+20.0
0.0%
jan 1, 1973
15.385
-4.615
-23.08%
jan 1, 1974
11.765
-3.62
-23.53%
jan 1, 1975
8.772
-2.993
-25.44%
jan 1, 1976
7.092
-1.68
-19.15%
jan 1, 1977
7.568
+0.475
6.7%
jan 1, 1978
8.543
+0.975
12.89%
jan 1, 1979
9.091
+0.548
6.42%
jan 1, 1980
10.204
+1.113
12.24%
jan 1, 1981
12.5
+2.296
22.5%
jan 1, 1982
11.969
-0.531
-4.25%
jan 1, 1983
13.284
+1.315
10.99%
jan 1, 1984
14.089
+0.805
6.06%
jan 1, 1985
13.993
-0.096
-0.68%
jan 1, 1986
15.254
+1.261
9.01%
jan 1, 1987
15.646
+0.392
2.57%
jan 1, 1988
16.388
+0.742
4.74%
jan 1, 1989
16.613
+0.225
1.38%
jan 1, 1990
17.042
+0.428
2.58%
jan 1, 1991
16.871
-0.171
-1.0%
jan 1, 1992
17.751
+0.88
5.22%
jan 1, 1993
18.156
+0.405
2.28%
jan 1, 1994
17.617
-0.54
-2.97%
jan 1, 1995
17.391
-0.225
-1.28%
jan 1, 1996
17.333
-0.058
-0.33%
jan 1, 1997
17.834
+0.501
2.89%
jan 1, 1998
17.092
-0.742
-4.16%
jan 1, 1999
19.026
+1.933
11.31%
jan 1, 2000
19.332
+0.306
1.61%
jan 1, 2001
18.326
-1.006
-5.2%
jan 1, 2002
19.49
+1.164
6.35%
jan 1, 2003
20.183
+0.694
3.56%
jan 1, 2004
17.524
-2.66
-13.18%
jan 1, 2005
19.715
+2.192
12.51%
jan 1, 2006
19.71
-0.006
-0.03%
jan 1, 2007
14.286
-5.424
-27.52%
jan 1, 2008
16.52
+2.235
15.64%
jan 1, 2009
15.651
-0.869
-5.26%
jan 1, 2010
15.074
-0.577
-3.69%
jan 1, 2011
17.201
+2.127
14.11%
jan 1, 2012
18.26
+1.058
6.15%
jan 1, 2013
19.225
+0.966
5.29%
jan 1, 2014
19.416
+0.191
0.99%
Ranking of countries by current statistics by years


Comments: