29
/
en
AIzaSyAYiBZKx7MnpbEhh9jyipgxe19OcubqV5w
April 1, 2024
40555
Late-demographic dividend
LTE
false
2
1
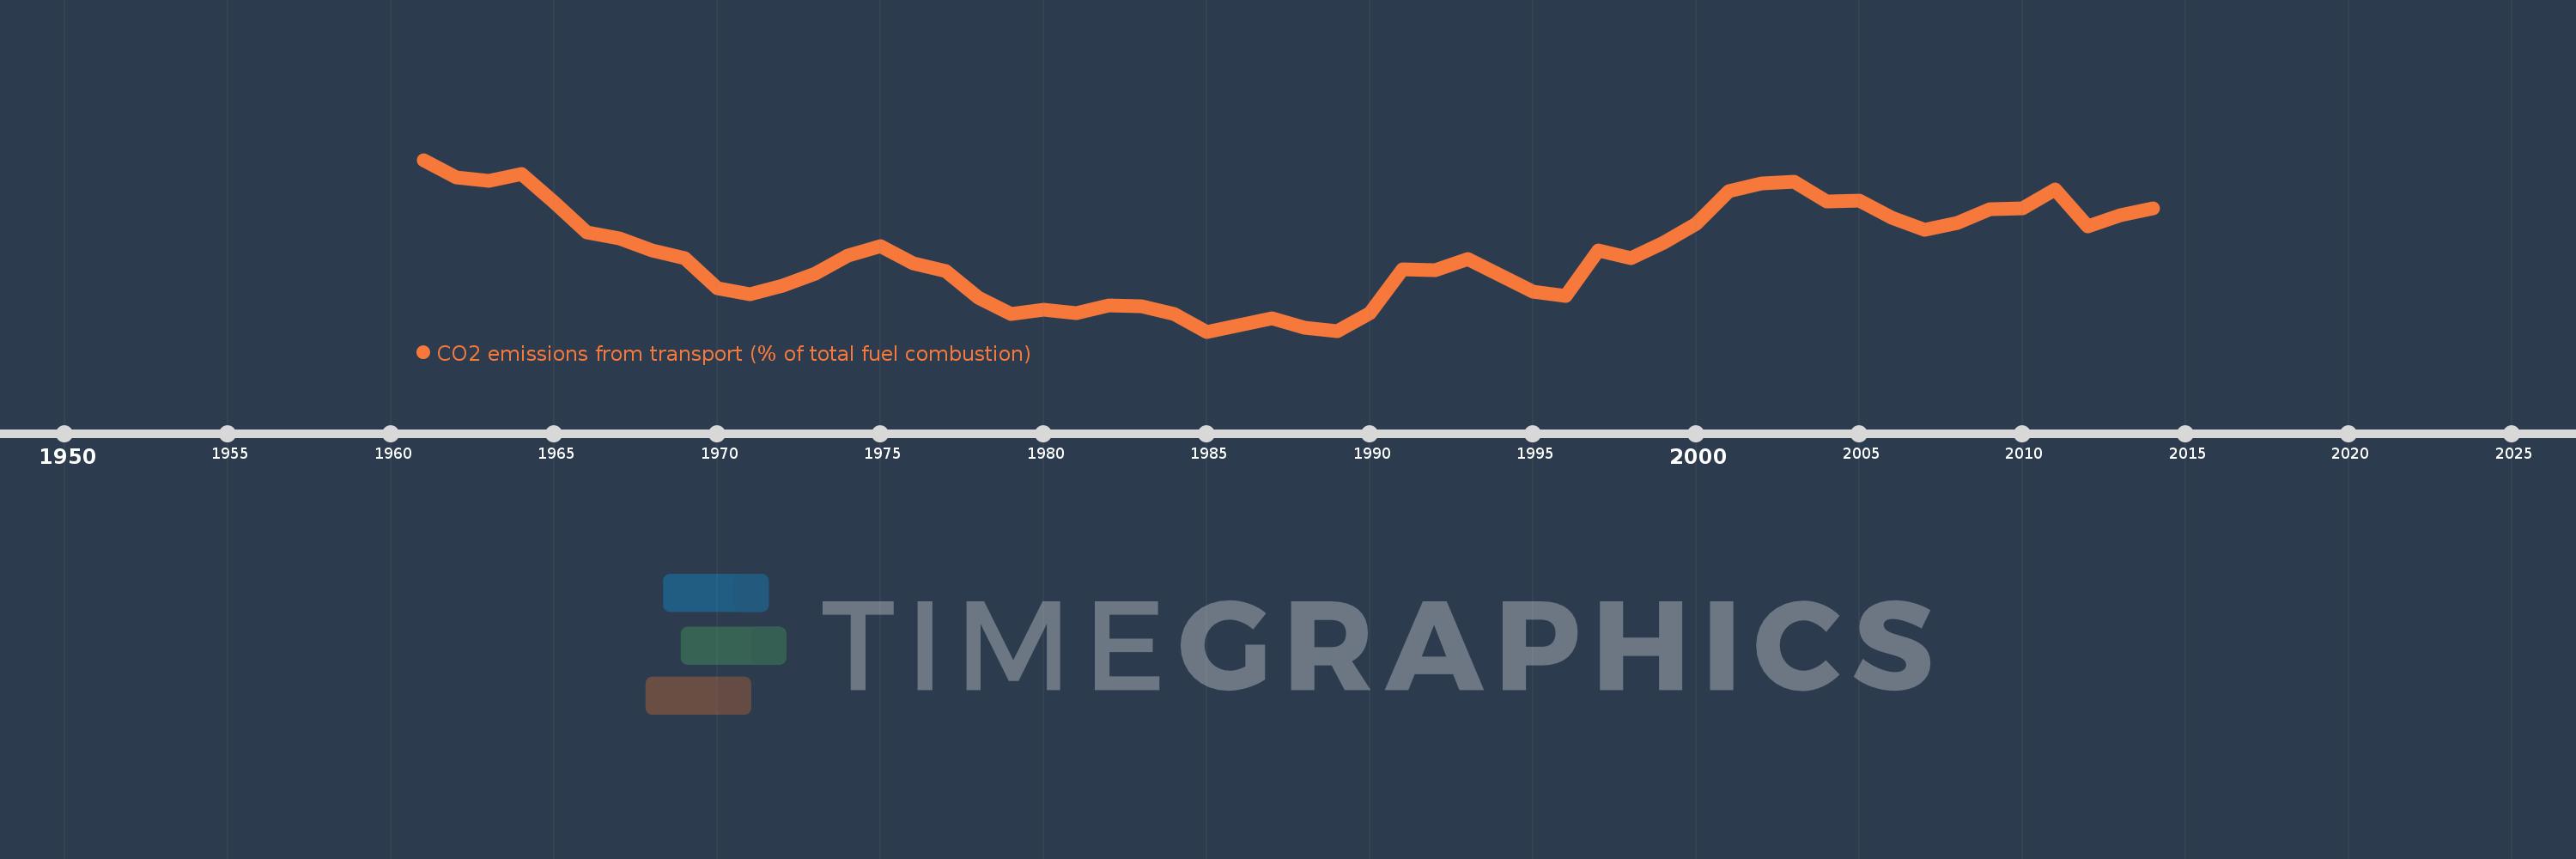
CO2 emissions from transport (% of total fuel combustion)
2014,2013,2012,2011,2010,2009,2008,2007,2006,2005,2004,2003,2002,2001,2000,1999,1998,1997,1996,1995,1994,1993,1992,1991,1990,1989,1988,1987,1986,1985,1984,1983,1982,1981,1980,1979,1978,1977,1976,1975,1974,1973,1972,1971,1970,1969,1968,1967,1966,1965,1964,1963,1962,1961
This statistics in other country:
AlbaniaAlgeriaAngolaArab WorldArgentinaArmeniaAustraliaAustriaAzerbaijanBahrainBangladeshBelarusBelgiumBeninBoliviaBosnia and HerzegovinaBotswanaBrazilBrunei DarussalamBulgariaCambodiaCameroonCanadaCaribbean small statesCentral Europe and the BalticsChileChinaColombiaCongo, Dem. Rep.Congo, Rep.Costa RicaCote d'IvoireCroatiaCubaCuracaoCyprusCzech RepublicDenmarkDominican RepublicEarly-demographic dividendEast Asia & PacificEast Asia & Pacific (excluding high income)East Asia & Pacific (IDA & IBRD countries)EcuadorEgypt, Arab Rep.El SalvadorEritreaEstoniaEthiopiaEuro areaEurope & Central AsiaEurope & Central Asia (excluding high income)Europe & Central Asia (IDA & IBRD countries)European UnionFinlandFragile and conflict affected situationsFranceGabonGeorgiaGermanyGhanaGibraltarGreeceGuatemalaHaitiHeavily indebted poor countries (HIPC)High incomeHondurasHong Kong SAR, ChinaHungaryIBRD onlyIcelandIDA & IBRD totalIDA blendIDA onlyIDA totalIndiaIndonesiaIran, Islamic Rep.IraqIrelandIsraelItalyJamaicaJapanJordanKazakhstanKenyaKorea, Dem. People’s Rep.Korea, Rep.KosovoKuwaitKyrgyz RepublicLate-demographic dividendLatin America & Caribbean Latin America & Caribbean (excluding high income)Latin America & the Caribbean (IDA & IBRD countries)LatviaLeast developed countries: UN classificationLebanonLibyaLithuaniaLow & middle incomeLow incomeLower middle incomeLuxembourgMacedonia, FYRMalaysiaMaltaMauritiusMexicoMiddle East & North AfricaMiddle East & North Africa (excluding high income)Middle East & North Africa (IDA & IBRD countries)Middle incomeMoldovaMongoliaMontenegroMoroccoMozambiqueMyanmarNamibiaNepalNetherlandsNew ZealandNicaraguaNigerNigeriaNorth AmericaNorwayOECD membersOmanOther small statesPakistanPanamaParaguayPeruPhilippinesPolandPortugalPost-demographic dividendPre-demographic dividendQatarRomaniaRussian FederationSaudi ArabiaSenegalSerbiaSingaporeSlovak RepublicSloveniaSmall statesSouth AfricaSouth AsiaSouth Asia (IDA & IBRD)South SudanSpainSri LankaSub-Saharan Africa Sub-Saharan Africa (excluding high income)Sub-Saharan Africa (IDA & IBRD countries)SudanSwedenSwitzerlandSyrian Arab RepublicTajikistanTanzaniaThailandTogoTrinidad and TobagoTunisiaTurkeyTurkmenistanUkraineUnited Arab EmiratesUnited KingdomUnited StatesUpper middle incomeUruguayUzbekistanVenezuela, RBVietnamWorldYemen, Rep.ZambiaZimbabwe Timeline:
This timeline shows a graph from 1961 to 2014 of Late-demographic dividend. No data until 1960. Number of actual observations by date: 54.
Source name:
World Development Indicators
Source organization:
IEA Statistics © OECD/IEA 2014 (http://www.iea.org/stats/index.asp), subject to https://www.iea.org/t&c/termsandconditions/
Categories, topics:
Environment
Last updated:
apr 23, 2017
Indicators value changes by year
At the date of observation
Value
Absolute change
Change from previous value
jan 1, 1961
13.6
+13.6
0.0%
jan 1, 1962
13.212
-0.388
-2.85%
jan 1, 1963
13.123
-0.089
-0.67%
jan 1, 1964
13.275
+0.151
1.15%
jan 1, 1965
12.644
-0.631
-4.75%
jan 1, 1966
11.971
-0.672
-5.32%
jan 1, 1967
11.852
-0.119
-1.0%
jan 1, 1968
11.585
-0.267
-2.25%
jan 1, 1969
11.405
-0.18
-1.56%
jan 1, 1970
10.74
-0.664
-5.82%
jan 1, 1971
10.593
-0.148
-1.37%
jan 1, 1972
10.786
+0.193
1.82%
jan 1, 1973
11.067
+0.281
2.6%
jan 1, 1974
11.466
+0.4
3.61%
jan 1, 1975
11.667
+0.2
1.75%
jan 1, 1976
11.293
-0.374
-3.2%
jan 1, 1977
11.127
-0.166
-1.47%
jan 1, 1978
10.522
-0.605
-5.44%
jan 1, 1979
10.152
-0.37
-3.52%
jan 1, 1980
10.248
+0.096
0.95%
jan 1, 1981
10.177
-0.072
-0.7%
jan 1, 1982
10.359
+0.183
1.79%
jan 1, 1983
10.332
-0.028
-0.27%
jan 1, 1984
10.162
-0.169
-1.64%
jan 1, 1985
9.767
-0.395
-3.89%
jan 1, 1986
9.911
+0.145
1.48%
jan 1, 1987
10.059
+0.148
1.49%
jan 1, 1988
9.854
-0.205
-2.04%
jan 1, 1989
9.786
-0.068
-0.69%
jan 1, 1990
10.183
+0.397
4.06%
jan 1, 1991
11.15
+0.966
9.49%
jan 1, 1992
11.142
-0.008
-0.07%
jan 1, 1993
11.396
+0.254
2.28%
jan 1, 1994
11.021
-0.374
-3.29%
jan 1, 1995
10.656
-0.365
-3.31%
jan 1, 1996
10.559
-0.097
-0.91%
jan 1, 1997
11.57
+1.011
9.57%
jan 1, 1998
11.397
-0.173
-1.5%
jan 1, 1999
11.744
+0.347
3.05%
jan 1, 2000
12.174
+0.429
3.65%
jan 1, 2001
12.908
+0.735
6.04%
jan 1, 2002
13.081
+0.172
1.33%
jan 1, 2003
13.116
+0.035
0.27%
jan 1, 2004
12.669
-0.448
-3.41%
jan 1, 2005
12.688
+0.02
0.16%
jan 1, 2006
12.308
-0.38
-3.0%
jan 1, 2007
12.047
-0.261
-2.12%
jan 1, 2008
12.19
+0.143
1.19%
jan 1, 2009
12.498
+0.308
2.53%
jan 1, 2010
12.523
+0.024
0.2%
jan 1, 2011
12.938
+0.415
3.31%
jan 1, 2012
12.123
-0.814
-6.3%
jan 1, 2013
12.373
+0.25
2.06%
jan 1, 2014
12.513
+0.14
1.13%
Ranking of countries by current statistics by years


Comments: