29
/
en
AIzaSyAYiBZKx7MnpbEhh9jyipgxe19OcubqV5w
April 1, 2024
115646
Cuba
CUB
true
2
1
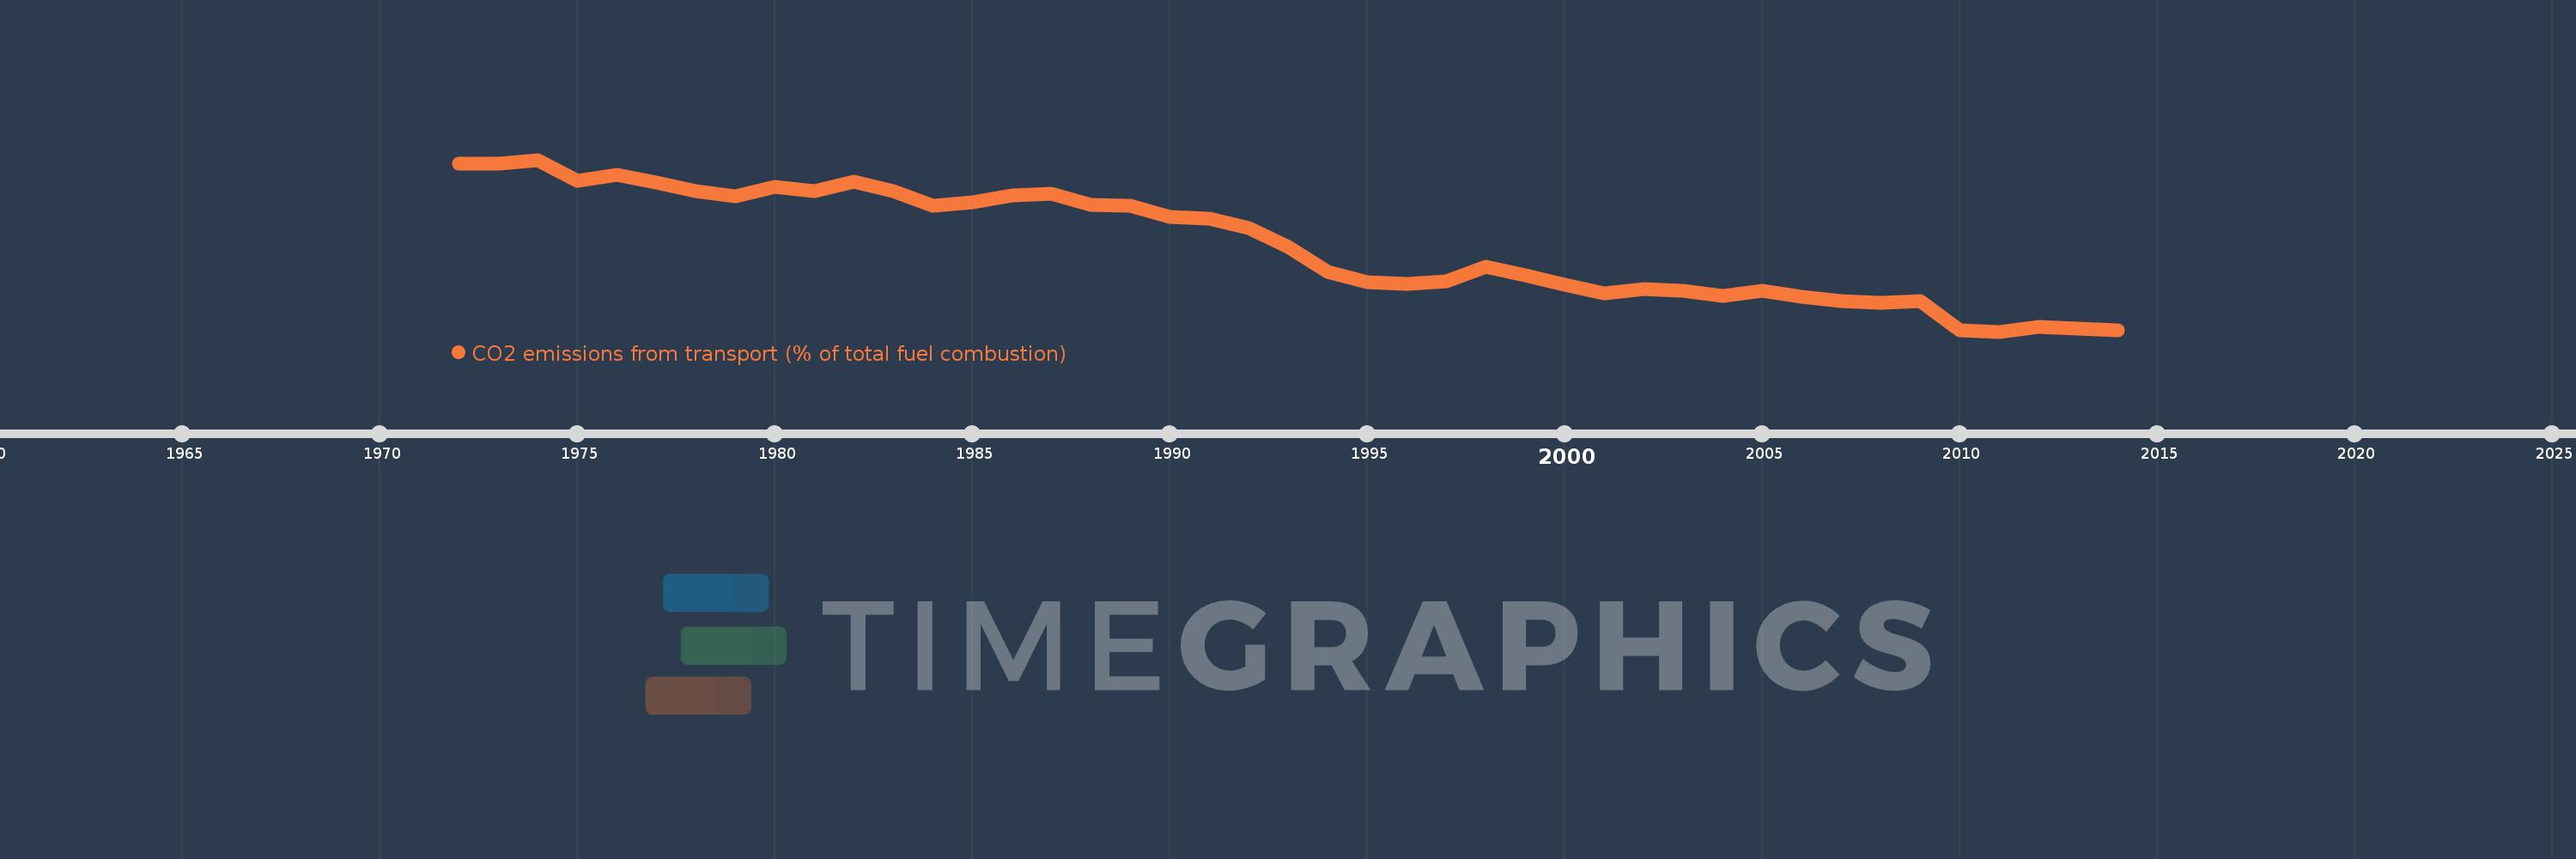
CO2 emissions from transport (% of total fuel combustion)
2014,2013,2012,2011,2010,2009,2008,2007,2006,2005,2004,2003,2002,2001,2000,1999,1998,1997,1996,1995,1994,1993,1992,1991,1990,1989,1988,1987,1986,1985,1984,1983,1982,1981,1980,1979,1978,1977,1976,1975,1974,1973,1972
This statistics in other country:
AlbaniaAlgeriaAngolaArab WorldArgentinaArmeniaAustraliaAustriaAzerbaijanBahrainBangladeshBelarusBelgiumBeninBoliviaBosnia and HerzegovinaBotswanaBrazilBrunei DarussalamBulgariaCambodiaCameroonCanadaCaribbean small statesCentral Europe and the BalticsChileChinaColombiaCongo, Dem. Rep.Congo, Rep.Costa RicaCote d'IvoireCroatiaCubaCuracaoCyprusCzech RepublicDenmarkDominican RepublicEarly-demographic dividendEast Asia & PacificEast Asia & Pacific (excluding high income)East Asia & Pacific (IDA & IBRD countries)EcuadorEgypt, Arab Rep.El SalvadorEritreaEstoniaEthiopiaEuro areaEurope & Central AsiaEurope & Central Asia (excluding high income)Europe & Central Asia (IDA & IBRD countries)European UnionFinlandFragile and conflict affected situationsFranceGabonGeorgiaGermanyGhanaGibraltarGreeceGuatemalaHaitiHeavily indebted poor countries (HIPC)High incomeHondurasHong Kong SAR, ChinaHungaryIBRD onlyIcelandIDA & IBRD totalIDA blendIDA onlyIDA totalIndiaIndonesiaIran, Islamic Rep.IraqIrelandIsraelItalyJamaicaJapanJordanKazakhstanKenyaKorea, Dem. People’s Rep.Korea, Rep.KosovoKuwaitKyrgyz RepublicLate-demographic dividendLatin America & Caribbean Latin America & Caribbean (excluding high income)Latin America & the Caribbean (IDA & IBRD countries)LatviaLeast developed countries: UN classificationLebanonLibyaLithuaniaLow & middle incomeLow incomeLower middle incomeLuxembourgMacedonia, FYRMalaysiaMaltaMauritiusMexicoMiddle East & North AfricaMiddle East & North Africa (excluding high income)Middle East & North Africa (IDA & IBRD countries)Middle incomeMoldovaMongoliaMontenegroMoroccoMozambiqueMyanmarNamibiaNepalNetherlandsNew ZealandNicaraguaNigerNigeriaNorth AmericaNorwayOECD membersOmanOther small statesPakistanPanamaParaguayPeruPhilippinesPolandPortugalPost-demographic dividendPre-demographic dividendQatarRomaniaRussian FederationSaudi ArabiaSenegalSerbiaSingaporeSlovak RepublicSloveniaSmall statesSouth AfricaSouth AsiaSouth Asia (IDA & IBRD)South SudanSpainSri LankaSub-Saharan Africa Sub-Saharan Africa (excluding high income)Sub-Saharan Africa (IDA & IBRD countries)SudanSwedenSwitzerlandSyrian Arab RepublicTajikistanTanzaniaThailandTogoTrinidad and TobagoTunisiaTurkeyTurkmenistanUkraineUnited Arab EmiratesUnited KingdomUnited StatesUpper middle incomeUruguayUzbekistanVenezuela, RBVietnamWorldYemen, Rep.ZambiaZimbabwe Timeline:
This timeline shows a graph from 1972 to 2014 of Cuba. No data until 1971. Number of actual observations by date: 43.
Source name:
World Development Indicators
Source organization:
IEA Statistics © OECD/IEA 2014 (http://www.iea.org/stats/index.asp), subject to https://www.iea.org/t&c/termsandconditions/
Categories, topics:
Environment
Last updated:
apr 23, 2017
Indicators value changes by year
Maximum:
20.323
jan 1, 1974
At the date of observation
Value
Absolute change
Change from previous value
jan 1, 1972
19.942
+19.942
0.0%
jan 1, 1973
19.97
+0.028
0.14%
jan 1, 1974
20.323
+0.352
1.76%
jan 1, 1975
18.344
-1.979
-9.74%
jan 1, 1976
18.9
+0.556
3.03%
jan 1, 1977
18.225
-0.675
-3.57%
jan 1, 1978
17.371
-0.855
-4.69%
jan 1, 1979
16.902
-0.468
-2.7%
jan 1, 1980
17.823
+0.921
5.45%
jan 1, 1981
17.388
-0.435
-2.44%
jan 1, 1982
18.275
+0.886
5.1%
jan 1, 1983
17.371
-0.903
-4.94%
jan 1, 1984
16.089
-1.282
-7.38%
jan 1, 1985
16.344
+0.255
1.59%
jan 1, 1986
16.972
+0.628
3.84%
jan 1, 1987
17.191
+0.219
1.29%
jan 1, 1988
16.161
-1.03
-5.99%
jan 1, 1989
16.05
-0.11
-0.68%
jan 1, 1990
15.05
-1.0
-6.23%
jan 1, 1991
14.868
-0.182
-1.21%
jan 1, 1992
14.011
-0.857
-5.76%
jan 1, 1993
12.247
-1.764
-12.59%
jan 1, 1994
9.934
-2.313
-18.89%
jan 1, 1995
8.928
-1.006
-10.13%
jan 1, 1996
8.791
-0.137
-1.53%
jan 1, 1997
9.016
+0.226
2.57%
jan 1, 1998
10.421
+1.404
15.57%
jan 1, 1999
9.559
-0.862
-8.27%
jan 1, 2000
8.739
-0.819
-8.57%
jan 1, 2001
7.937
-0.802
-9.18%
jan 1, 2002
8.343
+0.406
5.11%
jan 1, 2003
8.152
-0.191
-2.29%
jan 1, 2004
7.705
-0.447
-5.48%
jan 1, 2005
8.124
+0.419
5.44%
jan 1, 2006
7.616
-0.508
-6.25%
jan 1, 2007
7.193
-0.422
-5.54%
jan 1, 2008
7.024
-0.17
-2.36%
jan 1, 2009
7.168
+0.145
2.06%
jan 1, 2010
4.436
-2.732
-38.11%
jan 1, 2011
4.355
-0.081
-1.83%
jan 1, 2012
4.76
+0.405
9.3%
jan 1, 2013
4.643
-0.117
-2.45%
jan 1, 2014
4.465
-0.179
-3.85%
Ranking of countries by current statistics by years


Comments: