29
/
en
AIzaSyAYiBZKx7MnpbEhh9jyipgxe19OcubqV5w
April 1, 2024
69579
Argentina
ARG
true
2
1
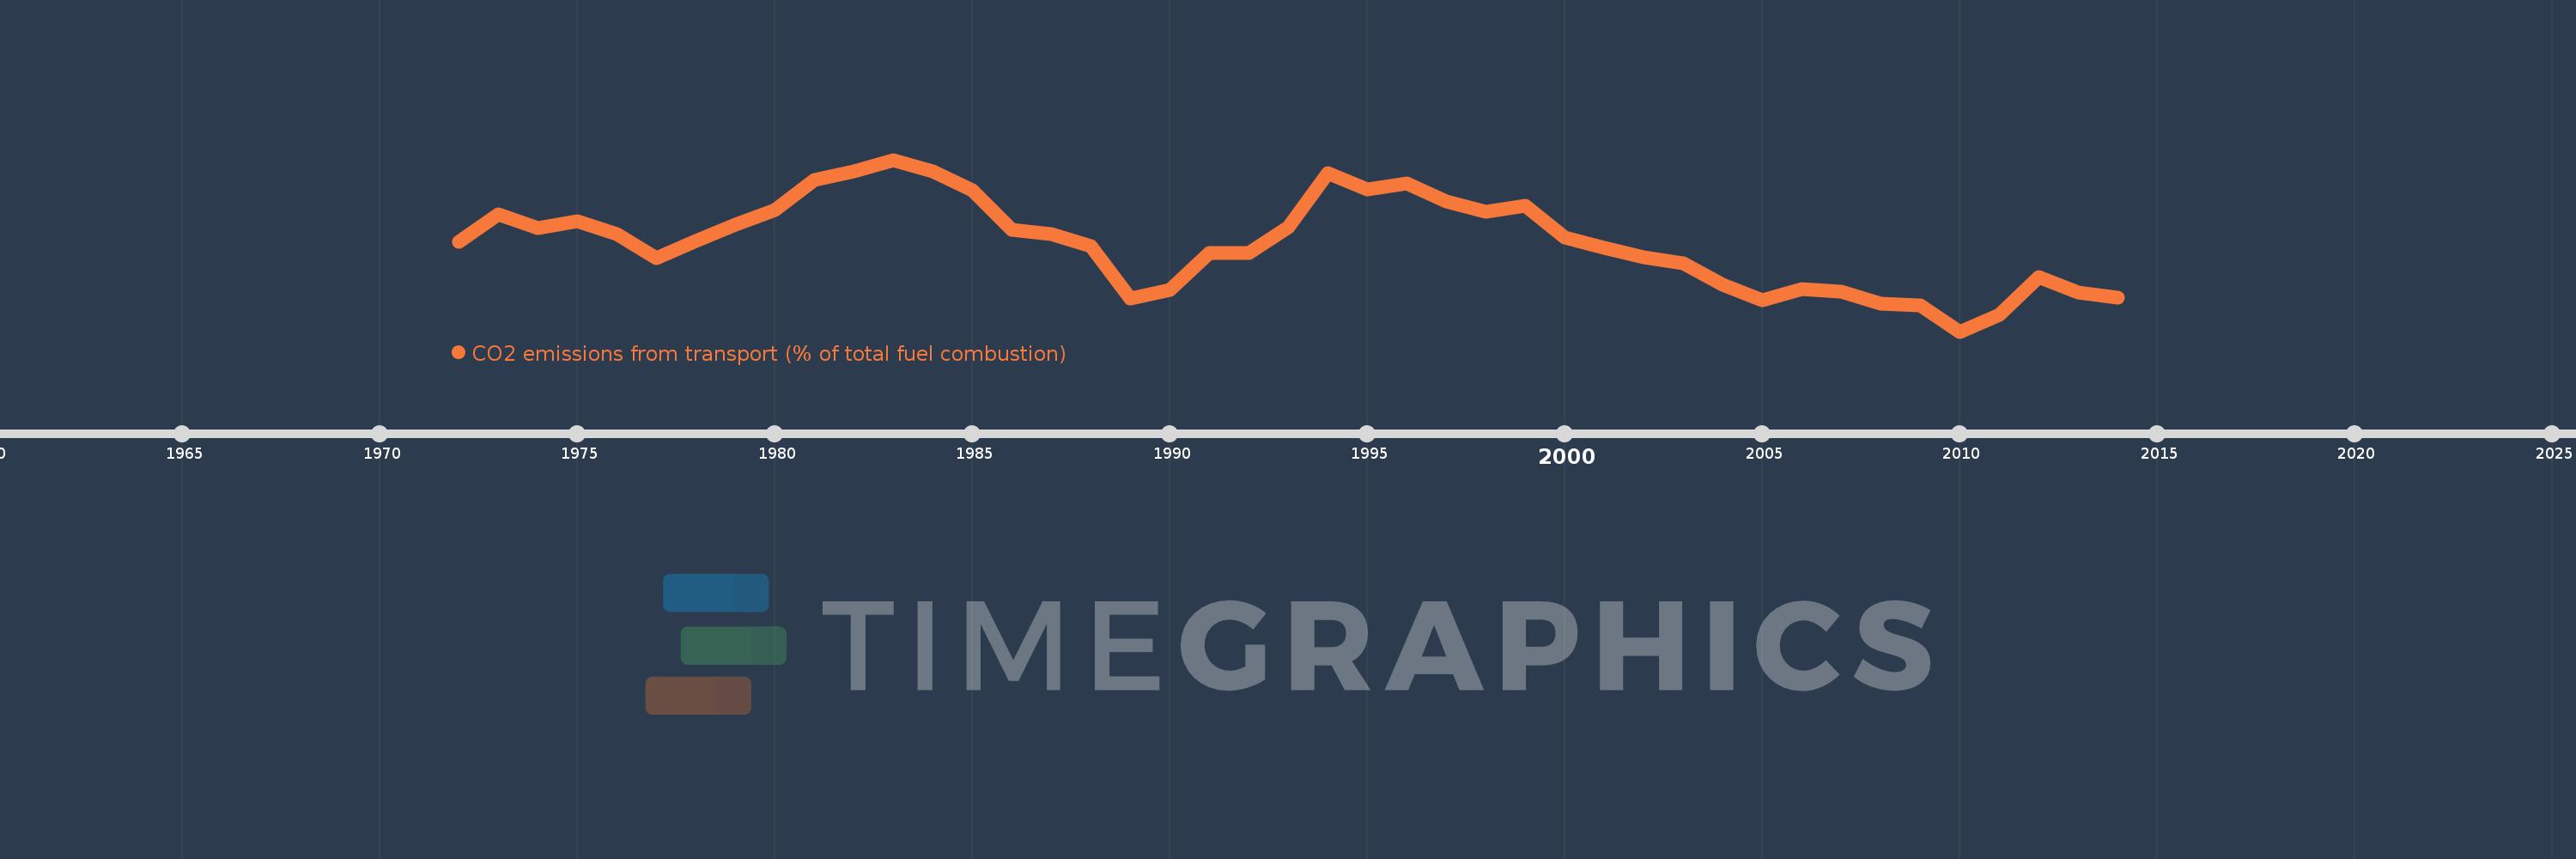
CO2 emissions from transport (% of total fuel combustion)
2014,2013,2012,2011,2010,2009,2008,2007,2006,2005,2004,2003,2002,2001,2000,1999,1998,1997,1996,1995,1994,1993,1992,1991,1990,1989,1988,1987,1986,1985,1984,1983,1982,1981,1980,1979,1978,1977,1976,1975,1974,1973,1972
This statistics in other country:
AlbaniaAlgeriaAngolaArab WorldArgentinaArmeniaAustraliaAustriaAzerbaijanBahrainBangladeshBelarusBelgiumBeninBoliviaBosnia and HerzegovinaBotswanaBrazilBrunei DarussalamBulgariaCambodiaCameroonCanadaCaribbean small statesCentral Europe and the BalticsChileChinaColombiaCongo, Dem. Rep.Congo, Rep.Costa RicaCote d'IvoireCroatiaCubaCuracaoCyprusCzech RepublicDenmarkDominican RepublicEarly-demographic dividendEast Asia & PacificEast Asia & Pacific (excluding high income)East Asia & Pacific (IDA & IBRD countries)EcuadorEgypt, Arab Rep.El SalvadorEritreaEstoniaEthiopiaEuro areaEurope & Central AsiaEurope & Central Asia (excluding high income)Europe & Central Asia (IDA & IBRD countries)European UnionFinlandFragile and conflict affected situationsFranceGabonGeorgiaGermanyGhanaGibraltarGreeceGuatemalaHaitiHeavily indebted poor countries (HIPC)High incomeHondurasHong Kong SAR, ChinaHungaryIBRD onlyIcelandIDA & IBRD totalIDA blendIDA onlyIDA totalIndiaIndonesiaIran, Islamic Rep.IraqIrelandIsraelItalyJamaicaJapanJordanKazakhstanKenyaKorea, Dem. People’s Rep.Korea, Rep.KosovoKuwaitKyrgyz RepublicLate-demographic dividendLatin America & Caribbean Latin America & Caribbean (excluding high income)Latin America & the Caribbean (IDA & IBRD countries)LatviaLeast developed countries: UN classificationLebanonLibyaLithuaniaLow & middle incomeLow incomeLower middle incomeLuxembourgMacedonia, FYRMalaysiaMaltaMauritiusMexicoMiddle East & North AfricaMiddle East & North Africa (excluding high income)Middle East & North Africa (IDA & IBRD countries)Middle incomeMoldovaMongoliaMontenegroMoroccoMozambiqueMyanmarNamibiaNepalNetherlandsNew ZealandNicaraguaNigerNigeriaNorth AmericaNorwayOECD membersOmanOther small statesPakistanPanamaParaguayPeruPhilippinesPolandPortugalPost-demographic dividendPre-demographic dividendQatarRomaniaRussian FederationSaudi ArabiaSenegalSerbiaSingaporeSlovak RepublicSloveniaSmall statesSouth AfricaSouth AsiaSouth Asia (IDA & IBRD)South SudanSpainSri LankaSub-Saharan Africa Sub-Saharan Africa (excluding high income)Sub-Saharan Africa (IDA & IBRD countries)SudanSwedenSwitzerlandSyrian Arab RepublicTajikistanTanzaniaThailandTogoTrinidad and TobagoTunisiaTurkeyTurkmenistanUkraineUnited Arab EmiratesUnited KingdomUnited StatesUpper middle incomeUruguayUzbekistanVenezuela, RBVietnamWorldYemen, Rep.ZambiaZimbabwe Timeline:
This timeline shows a graph from 1972 to 2014 of Argentina. No data until 1971. Number of actual observations by date: 43.
Source name:
World Development Indicators
Source organization:
IEA Statistics © OECD/IEA 2014 (http://www.iea.org/stats/index.asp), subject to https://www.iea.org/t&c/termsandconditions/
Categories, topics:
Environment
Last updated:
apr 23, 2017
Indicators value changes by year
Minimum:
24.017
jan 1, 2010
Maximum:
34.048
jan 1, 1983
At the date of observation
Value
Absolute change
Change from previous value
jan 1, 1972
29.24
+29.24
0.0%
jan 1, 1973
30.871
+1.632
5.58%
jan 1, 1974
30.085
-0.787
-2.55%
jan 1, 1975
30.44
+0.355
1.18%
jan 1, 1976
29.718
-0.721
-2.37%
jan 1, 1977
28.288
-1.43
-4.81%
jan 1, 1978
29.29
+1.002
3.54%
jan 1, 1979
30.283
+0.993
3.39%
jan 1, 1980
31.091
+0.808
2.67%
jan 1, 1981
32.849
+1.759
5.66%
jan 1, 1982
33.369
+0.519
1.58%
jan 1, 1983
34.048
+0.679
2.03%
jan 1, 1984
33.376
-0.672
-1.97%
jan 1, 1985
32.252
-1.123
-3.37%
jan 1, 1986
29.969
-2.283
-7.08%
jan 1, 1987
29.733
-0.237
-0.79%
jan 1, 1988
28.997
-0.736
-2.48%
jan 1, 1989
25.962
-3.035
-10.47%
jan 1, 1990
26.447
+0.485
1.87%
jan 1, 1991
28.612
+2.165
8.18%
jan 1, 1992
28.593
-0.018
-0.06%
jan 1, 1993
30.134
+1.541
5.39%
jan 1, 1994
33.287
+3.153
10.46%
jan 1, 1995
32.321
-0.966
-2.9%
jan 1, 1996
32.649
+0.328
1.01%
jan 1, 1997
31.6
-1.048
-3.21%
jan 1, 1998
31.03
-0.571
-1.81%
jan 1, 1999
31.378
+0.349
1.12%
jan 1, 2000
29.503
-1.876
-5.98%
jan 1, 2001
28.886
-0.616
-2.09%
jan 1, 2002
28.378
-0.508
-1.76%
jan 1, 2003
28.005
-0.373
-1.32%
jan 1, 2004
26.733
-1.272
-4.54%
jan 1, 2005
25.856
-0.877
-3.28%
jan 1, 2006
26.512
+0.656
2.54%
jan 1, 2007
26.329
-0.183
-0.69%
jan 1, 2008
25.645
-0.685
-2.6%
jan 1, 2009
25.535
-0.11
-0.43%
jan 1, 2010
24.017
-1.518
-5.94%
jan 1, 2011
25.007
+0.99
4.12%
jan 1, 2012
27.214
+2.207
8.83%
jan 1, 2013
26.321
-0.894
-3.28%
jan 1, 2014
26.015
-0.306
-1.16%
Ranking of countries by current statistics by years


Comments: