29
/
en
AIzaSyAYiBZKx7MnpbEhh9jyipgxe19OcubqV5w
April 1, 2024
132961
Finland
FIN
true
2
1
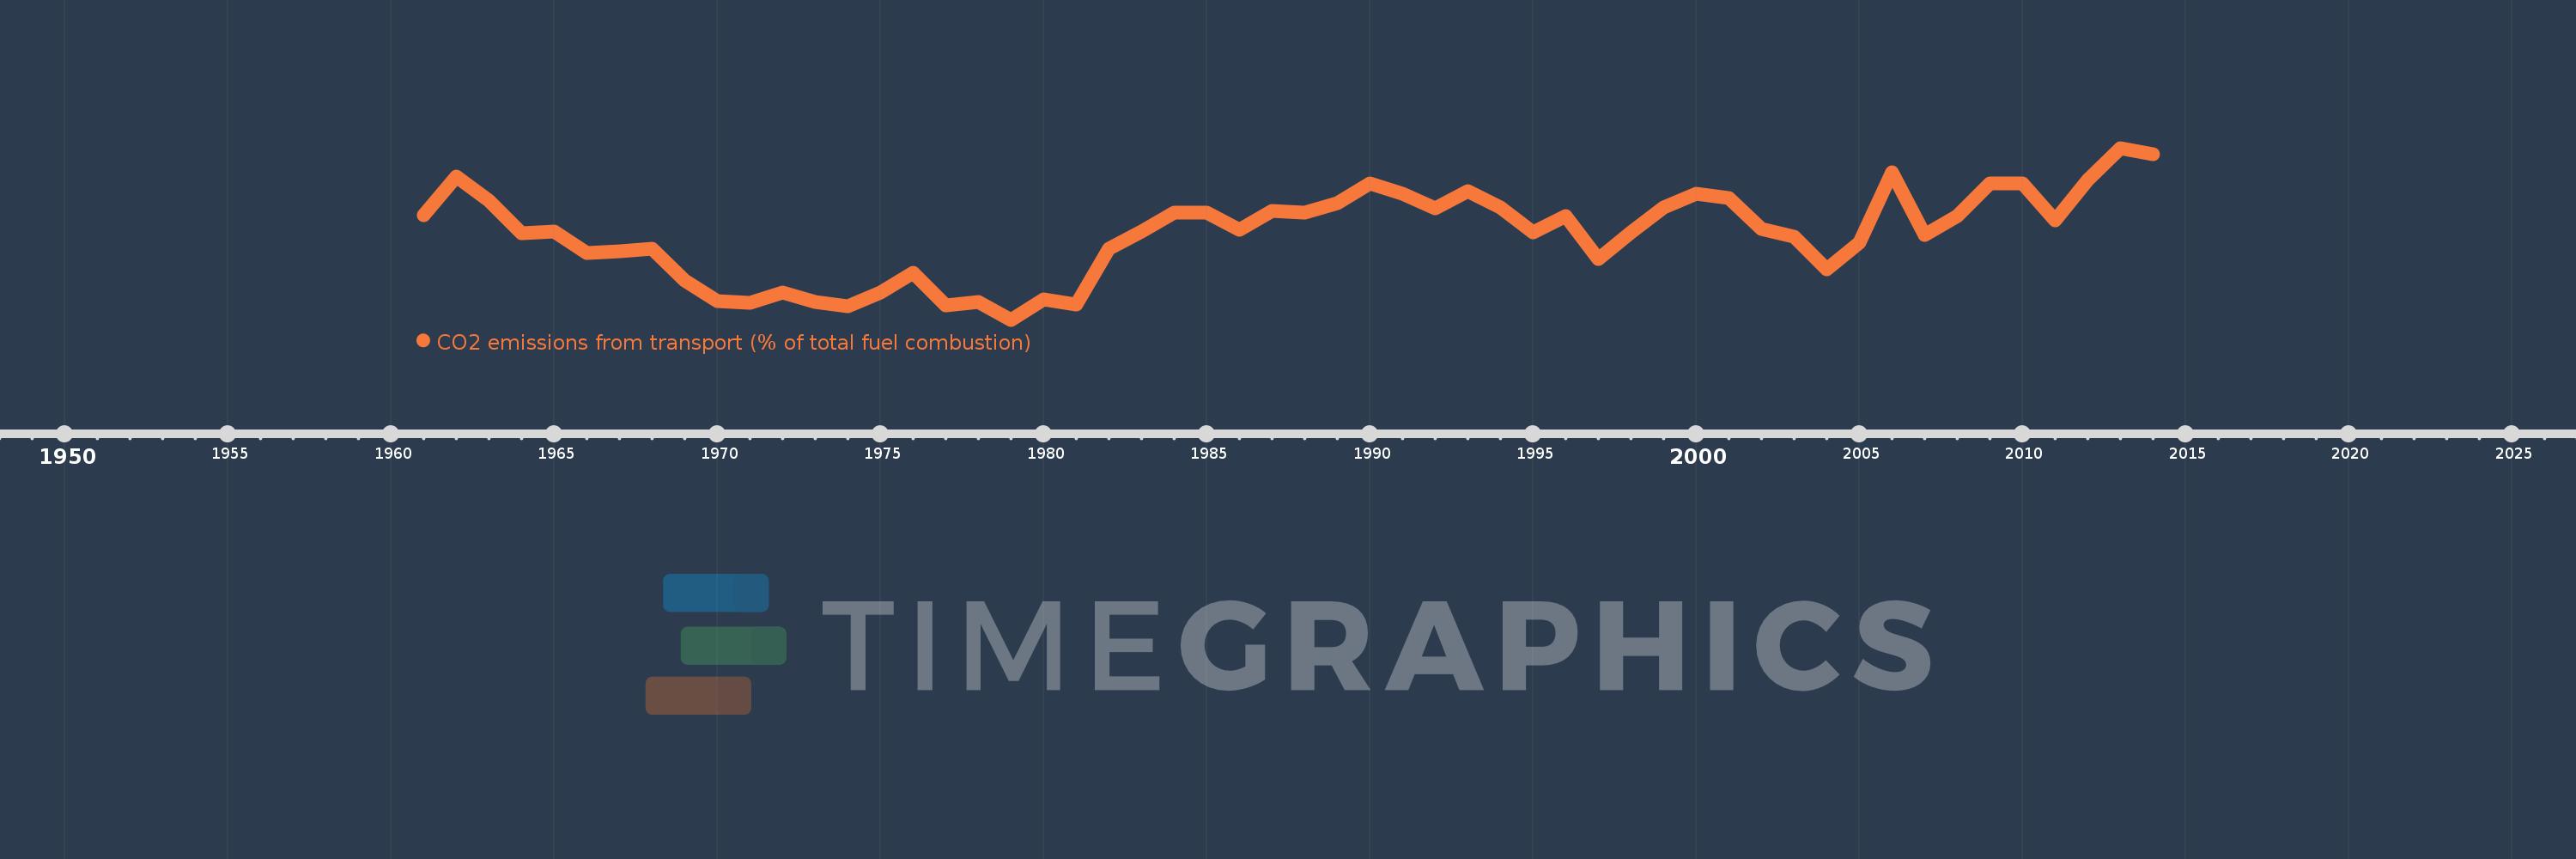
CO2 emissions from transport (% of total fuel combustion)
2014,2013,2012,2011,2010,2009,2008,2007,2006,2005,2004,2003,2002,2001,2000,1999,1998,1997,1996,1995,1994,1993,1992,1991,1990,1989,1988,1987,1986,1985,1984,1983,1982,1981,1980,1979,1978,1977,1976,1975,1974,1973,1972,1971,1970,1969,1968,1967,1966,1965,1964,1963,1962,1961
This statistics in other country:
AlbaniaAlgeriaAngolaArab WorldArgentinaArmeniaAustraliaAustriaAzerbaijanBahrainBangladeshBelarusBelgiumBeninBoliviaBosnia and HerzegovinaBotswanaBrazilBrunei DarussalamBulgariaCambodiaCameroonCanadaCaribbean small statesCentral Europe and the BalticsChileChinaColombiaCongo, Dem. Rep.Congo, Rep.Costa RicaCote d'IvoireCroatiaCubaCuracaoCyprusCzech RepublicDenmarkDominican RepublicEarly-demographic dividendEast Asia & PacificEast Asia & Pacific (excluding high income)East Asia & Pacific (IDA & IBRD countries)EcuadorEgypt, Arab Rep.El SalvadorEritreaEstoniaEthiopiaEuro areaEurope & Central AsiaEurope & Central Asia (excluding high income)Europe & Central Asia (IDA & IBRD countries)European UnionFinlandFragile and conflict affected situationsFranceGabonGeorgiaGermanyGhanaGibraltarGreeceGuatemalaHaitiHeavily indebted poor countries (HIPC)High incomeHondurasHong Kong SAR, ChinaHungaryIBRD onlyIcelandIDA & IBRD totalIDA blendIDA onlyIDA totalIndiaIndonesiaIran, Islamic Rep.IraqIrelandIsraelItalyJamaicaJapanJordanKazakhstanKenyaKorea, Dem. People’s Rep.Korea, Rep.KosovoKuwaitKyrgyz RepublicLate-demographic dividendLatin America & Caribbean Latin America & Caribbean (excluding high income)Latin America & the Caribbean (IDA & IBRD countries)LatviaLeast developed countries: UN classificationLebanonLibyaLithuaniaLow & middle incomeLow incomeLower middle incomeLuxembourgMacedonia, FYRMalaysiaMaltaMauritiusMexicoMiddle East & North AfricaMiddle East & North Africa (excluding high income)Middle East & North Africa (IDA & IBRD countries)Middle incomeMoldovaMongoliaMontenegroMoroccoMozambiqueMyanmarNamibiaNepalNetherlandsNew ZealandNicaraguaNigerNigeriaNorth AmericaNorwayOECD membersOmanOther small statesPakistanPanamaParaguayPeruPhilippinesPolandPortugalPost-demographic dividendPre-demographic dividendQatarRomaniaRussian FederationSaudi ArabiaSenegalSerbiaSingaporeSlovak RepublicSloveniaSmall statesSouth AfricaSouth AsiaSouth Asia (IDA & IBRD)South SudanSpainSri LankaSub-Saharan Africa Sub-Saharan Africa (excluding high income)Sub-Saharan Africa (IDA & IBRD countries)SudanSwedenSwitzerlandSyrian Arab RepublicTajikistanTanzaniaThailandTogoTrinidad and TobagoTunisiaTurkeyTurkmenistanUkraineUnited Arab EmiratesUnited KingdomUnited StatesUpper middle incomeUruguayUzbekistanVenezuela, RBVietnamWorldYemen, Rep.ZambiaZimbabwe Timeline:
This timeline shows a graph from 1961 to 2014 of Finland. No data until 1960. Number of actual observations by date: 54.
Source name:
World Development Indicators
Source organization:
IEA Statistics © OECD/IEA 2014 (http://www.iea.org/stats/index.asp), subject to https://www.iea.org/t&c/termsandconditions/
Categories, topics:
Environment
Last updated:
apr 23, 2017
Indicators value changes by year
Minimum:
14.244
jan 1, 1979
At the date of observation
Value
Absolute change
Change from previous value
jan 1, 1961
20.549
+20.549
0.0%
jan 1, 1962
22.859
+2.31
11.24%
jan 1, 1963
21.433
-1.426
-6.24%
jan 1, 1964
19.487
-1.946
-9.08%
jan 1, 1965
19.587
+0.1
0.51%
jan 1, 1966
18.289
-1.299
-6.63%
jan 1, 1967
18.383
+0.095
0.52%
jan 1, 1968
18.521
+0.138
0.75%
jan 1, 1969
16.602
-1.919
-10.36%
jan 1, 1970
15.378
-1.224
-7.37%
jan 1, 1971
15.249
-0.129
-0.84%
jan 1, 1972
15.863
+0.615
4.03%
jan 1, 1973
15.325
-0.539
-3.4%
jan 1, 1974
15.049
-0.276
-1.8%
jan 1, 1975
15.909
+0.86
5.71%
jan 1, 1976
17.093
+1.184
7.45%
jan 1, 1977
15.122
-1.971
-11.53%
jan 1, 1978
15.337
+0.215
1.42%
jan 1, 1979
14.244
-1.093
-7.13%
jan 1, 1980
15.49
+1.246
8.75%
jan 1, 1981
15.187
-0.303
-1.96%
jan 1, 1982
18.537
+3.35
22.06%
jan 1, 1983
19.582
+1.045
5.64%
jan 1, 1984
20.733
+1.15
5.87%
jan 1, 1985
20.687
-0.045
-0.22%
jan 1, 1986
19.681
-1.006
-4.86%
jan 1, 1987
20.809
+1.128
5.73%
jan 1, 1988
20.702
-0.108
-0.52%
jan 1, 1989
21.259
+0.558
2.69%
jan 1, 1990
22.451
+1.192
5.61%
jan 1, 1991
21.867
-0.584
-2.6%
jan 1, 1992
20.987
-0.881
-4.03%
jan 1, 1993
22.013
+1.026
4.89%
jan 1, 1994
21.033
-0.98
-4.45%
jan 1, 1995
19.501
-1.532
-7.28%
jan 1, 1996
20.498
+0.997
5.11%
jan 1, 1997
17.909
-2.589
-12.63%
jan 1, 1998
19.526
+1.617
9.03%
jan 1, 1999
20.996
+1.47
7.53%
jan 1, 2000
21.867
+0.871
4.15%
jan 1, 2001
21.61
-0.257
-1.17%
jan 1, 2002
19.722
-1.888
-8.74%
jan 1, 2003
19.272
-0.449
-2.28%
jan 1, 2004
17.301
-1.972
-10.23%
jan 1, 2005
18.87
+1.569
9.07%
jan 1, 2006
23.146
+4.276
22.66%
jan 1, 2007
19.353
-3.793
-16.39%
jan 1, 2008
20.492
+1.139
5.89%
jan 1, 2009
22.463
+1.971
9.62%
jan 1, 2010
22.454
-0.01
-0.04%
jan 1, 2011
20.237
-2.216
-9.87%
jan 1, 2012
22.684
+2.447
12.09%
jan 1, 2013
24.61
+1.926
8.49%
jan 1, 2014
24.212
-0.397
-1.62%
Ranking of countries by current statistics by years


Comments: