29
/
en
AIzaSyAYiBZKx7MnpbEhh9jyipgxe19OcubqV5w
April 1, 2024
34100
Fragile and conflict affected situations
FCS
false
2
1
CO2 emissions from transport (% of total fuel combustion)
2014,2013,2012,2011,2010,2009,2008,2007,2006,2005,2004,2003,2002,2001,2000,1999,1998,1997,1996,1995,1994,1993,1992,1991,1990,1989,1988,1987,1986,1985,1984,1983,1982,1981,1980,1979,1978,1977,1976,1975,1974,1973,1972
This statistics in other country:
AlbaniaAlgeriaAngolaArab WorldArgentinaArmeniaAustraliaAustriaAzerbaijanBahrainBangladeshBelarusBelgiumBeninBoliviaBosnia and HerzegovinaBotswanaBrazilBrunei DarussalamBulgariaCambodiaCameroonCanadaCaribbean small statesCentral Europe and the BalticsChileChinaColombiaCongo, Dem. Rep.Congo, Rep.Costa RicaCote d'IvoireCroatiaCubaCuracaoCyprusCzech RepublicDenmarkDominican RepublicEarly-demographic dividendEast Asia & PacificEast Asia & Pacific (excluding high income)East Asia & Pacific (IDA & IBRD countries)EcuadorEgypt, Arab Rep.El SalvadorEritreaEstoniaEthiopiaEuro areaEurope & Central AsiaEurope & Central Asia (excluding high income)Europe & Central Asia (IDA & IBRD countries)European UnionFinlandFragile and conflict affected situationsFranceGabonGeorgiaGermanyGhanaGibraltarGreeceGuatemalaHaitiHeavily indebted poor countries (HIPC)High incomeHondurasHong Kong SAR, ChinaHungaryIBRD onlyIcelandIDA & IBRD totalIDA blendIDA onlyIDA totalIndiaIndonesiaIran, Islamic Rep.IraqIrelandIsraelItalyJamaicaJapanJordanKazakhstanKenyaKorea, Dem. People’s Rep.Korea, Rep.KosovoKuwaitKyrgyz RepublicLate-demographic dividendLatin America & Caribbean Latin America & Caribbean (excluding high income)Latin America & the Caribbean (IDA & IBRD countries)LatviaLeast developed countries: UN classificationLebanonLibyaLithuaniaLow & middle incomeLow incomeLower middle incomeLuxembourgMacedonia, FYRMalaysiaMaltaMauritiusMexicoMiddle East & North AfricaMiddle East & North Africa (excluding high income)Middle East & North Africa (IDA & IBRD countries)Middle incomeMoldovaMongoliaMontenegroMoroccoMozambiqueMyanmarNamibiaNepalNetherlandsNew ZealandNicaraguaNigerNigeriaNorth AmericaNorwayOECD membersOmanOther small statesPakistanPanamaParaguayPeruPhilippinesPolandPortugalPost-demographic dividendPre-demographic dividendQatarRomaniaRussian FederationSaudi ArabiaSenegalSerbiaSingaporeSlovak RepublicSloveniaSmall statesSouth AfricaSouth AsiaSouth Asia (IDA & IBRD)South SudanSpainSri LankaSub-Saharan Africa Sub-Saharan Africa (excluding high income)Sub-Saharan Africa (IDA & IBRD countries)SudanSwedenSwitzerlandSyrian Arab RepublicTajikistanTanzaniaThailandTogoTrinidad and TobagoTunisiaTurkeyTurkmenistanUkraineUnited Arab EmiratesUnited KingdomUnited StatesUpper middle incomeUruguayUzbekistanVenezuela, RBVietnamWorldYemen, Rep.ZambiaZimbabwe Timeline:
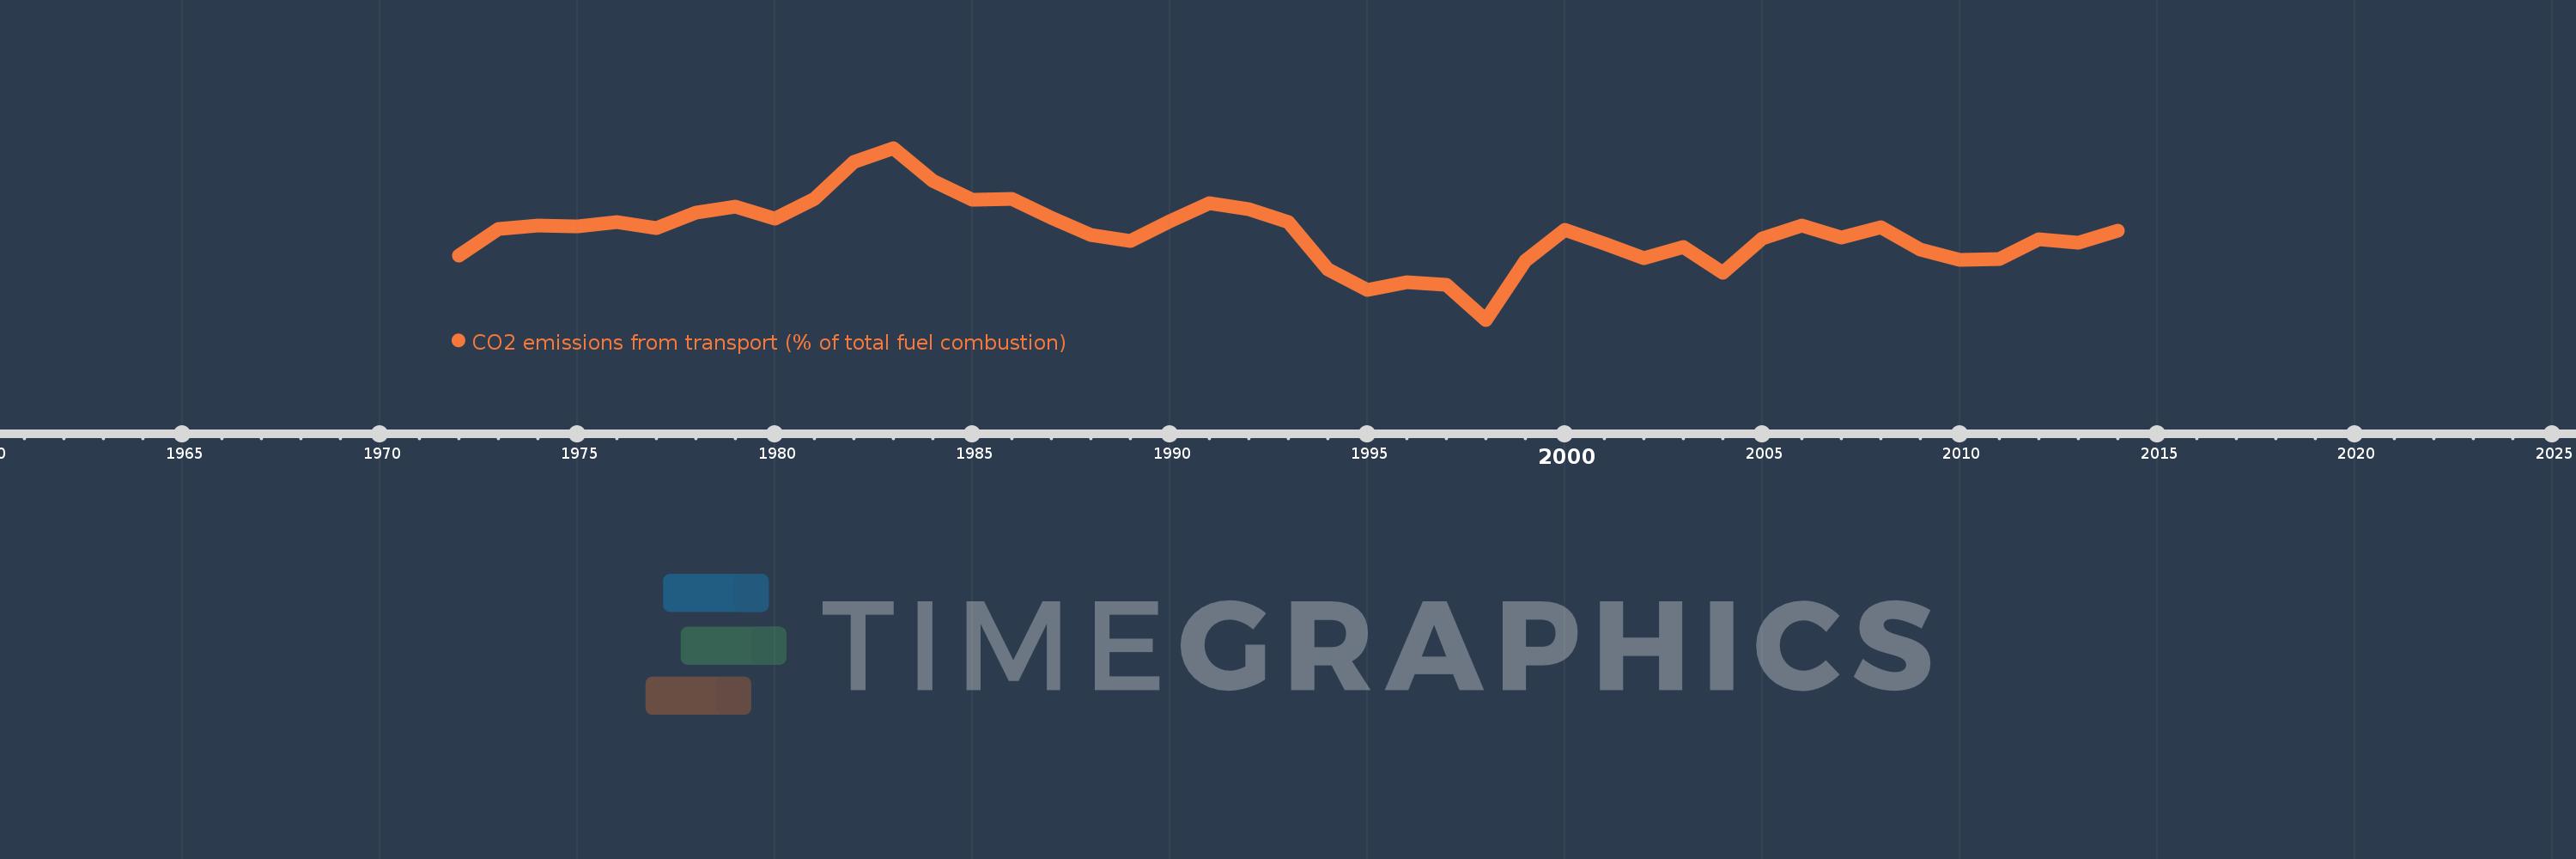
This timeline shows a graph from 1972 to 2014 of Fragile and conflict affected situations. No data until 1971. Number of actual observations by date: 43.
Source name:
World Development Indicators
Source organization:
IEA Statistics © OECD/IEA 2014 (http://www.iea.org/stats/index.asp), subject to https://www.iea.org/t&c/termsandconditions/
Categories, topics:
Environment
Last updated:
apr 23, 2017
Indicators value changes by year
Minimum:
25.412
jan 1, 1998
Maximum:
37.883
jan 1, 1983
At the date of observation
Value
Absolute change
Change from previous value
jan 1, 1972
30.081
+30.081
0.0%
jan 1, 1973
32.031
+1.95
6.48%
jan 1, 1974
32.227
+0.197
0.61%
jan 1, 1975
32.17
-0.057
-0.18%
jan 1, 1976
32.514
+0.344
1.07%
jan 1, 1977
32.076
-0.438
-1.35%
jan 1, 1978
33.166
+1.09
3.4%
jan 1, 1979
33.624
+0.458
1.38%
jan 1, 1980
32.777
-0.847
-2.52%
jan 1, 1981
34.194
+1.417
4.32%
jan 1, 1982
36.895
+2.702
7.9%
jan 1, 1983
37.883
+0.987
2.68%
jan 1, 1984
35.522
-2.36
-6.23%
jan 1, 1985
34.154
-1.369
-3.85%
jan 1, 1986
34.156
+0.003
0.01%
jan 1, 1987
32.798
-1.358
-3.98%
jan 1, 1988
31.574
-1.224
-3.73%
jan 1, 1989
31.119
-0.455
-1.44%
jan 1, 1990
32.58
+1.461
4.7%
jan 1, 1991
33.844
+1.264
3.88%
jan 1, 1992
33.424
-0.42
-1.24%
jan 1, 1993
32.495
-0.929
-2.78%
jan 1, 1994
29.078
-3.417
-10.52%
jan 1, 1995
27.604
-1.474
-5.07%
jan 1, 1996
28.129
+0.526
1.9%
jan 1, 1997
27.976
-0.154
-0.55%
jan 1, 1998
25.412
-2.564
-9.16%
jan 1, 1999
29.676
+4.264
16.78%
jan 1, 2000
31.956
+2.28
7.68%
jan 1, 2001
30.947
-1.009
-3.16%
jan 1, 2002
29.901
-1.046
-3.38%
jan 1, 2003
30.707
+0.806
2.7%
jan 1, 2004
28.835
-1.872
-6.1%
jan 1, 2005
31.335
+2.5
8.67%
jan 1, 2006
32.273
+0.938
2.99%
jan 1, 2007
31.357
-0.917
-2.84%
jan 1, 2008
32.099
+0.743
2.37%
jan 1, 2009
30.51
-1.589
-4.95%
jan 1, 2010
29.745
-0.766
-2.51%
jan 1, 2011
29.816
+0.071
0.24%
jan 1, 2012
31.258
+1.442
4.84%
jan 1, 2013
30.987
-0.271
-0.87%
jan 1, 2014
31.873
+0.886
2.86%
Ranking of countries by current statistics by years


Comments: