29
/
en
AIzaSyAYiBZKx7MnpbEhh9jyipgxe19OcubqV5w
April 1, 2024
210122
Nicaragua
NIC
true
2
1
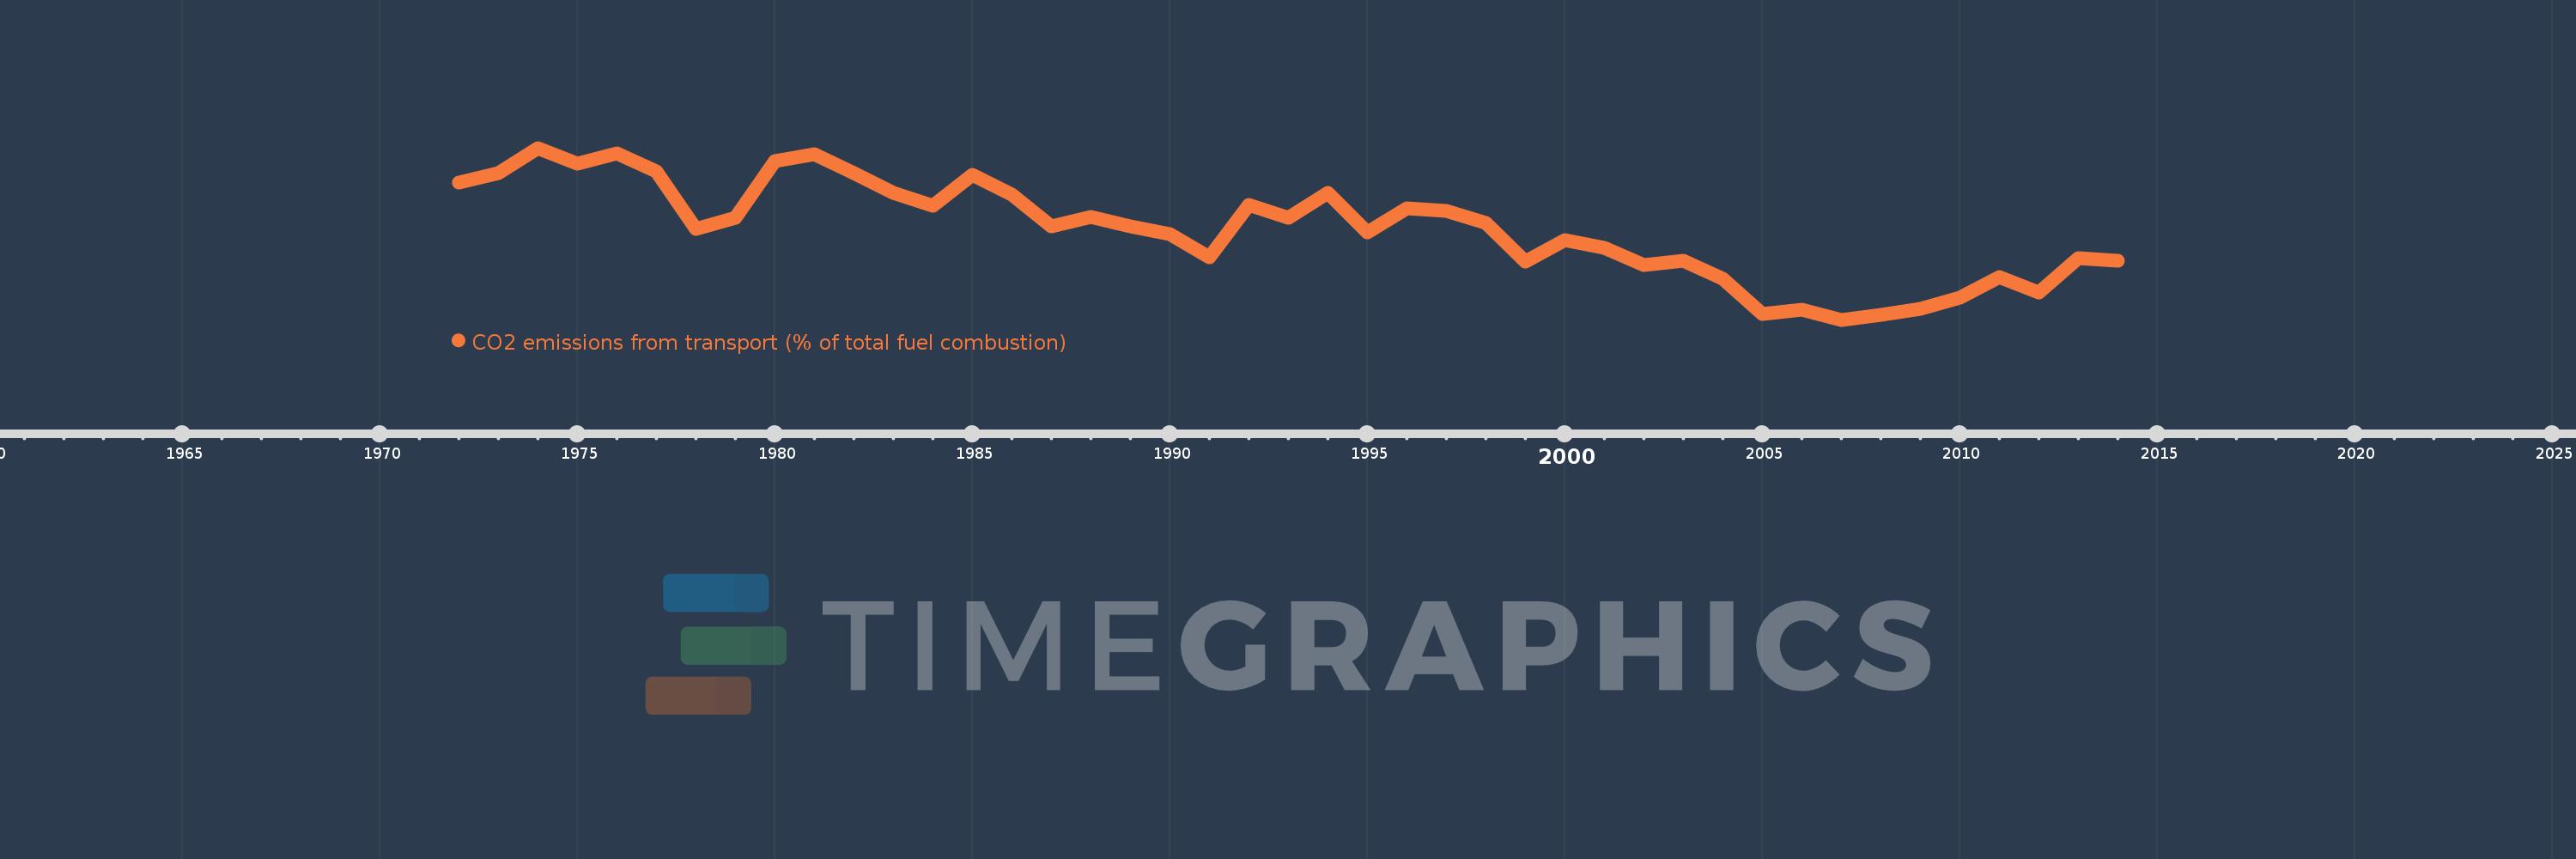
CO2 emissions from transport (% of total fuel combustion)
2014,2013,2012,2011,2010,2009,2008,2007,2006,2005,2004,2003,2002,2001,2000,1999,1998,1997,1996,1995,1994,1993,1992,1991,1990,1989,1988,1987,1986,1985,1984,1983,1982,1981,1980,1979,1978,1977,1976,1975,1974,1973,1972
This statistics in other country:
AlbaniaAlgeriaAngolaArab WorldArgentinaArmeniaAustraliaAustriaAzerbaijanBahrainBangladeshBelarusBelgiumBeninBoliviaBosnia and HerzegovinaBotswanaBrazilBrunei DarussalamBulgariaCambodiaCameroonCanadaCaribbean small statesCentral Europe and the BalticsChileChinaColombiaCongo, Dem. Rep.Congo, Rep.Costa RicaCote d'IvoireCroatiaCubaCuracaoCyprusCzech RepublicDenmarkDominican RepublicEarly-demographic dividendEast Asia & PacificEast Asia & Pacific (excluding high income)East Asia & Pacific (IDA & IBRD countries)EcuadorEgypt, Arab Rep.El SalvadorEritreaEstoniaEthiopiaEuro areaEurope & Central AsiaEurope & Central Asia (excluding high income)Europe & Central Asia (IDA & IBRD countries)European UnionFinlandFragile and conflict affected situationsFranceGabonGeorgiaGermanyGhanaGibraltarGreeceGuatemalaHaitiHeavily indebted poor countries (HIPC)High incomeHondurasHong Kong SAR, ChinaHungaryIBRD onlyIcelandIDA & IBRD totalIDA blendIDA onlyIDA totalIndiaIndonesiaIran, Islamic Rep.IraqIrelandIsraelItalyJamaicaJapanJordanKazakhstanKenyaKorea, Dem. People’s Rep.Korea, Rep.KosovoKuwaitKyrgyz RepublicLate-demographic dividendLatin America & Caribbean Latin America & Caribbean (excluding high income)Latin America & the Caribbean (IDA & IBRD countries)LatviaLeast developed countries: UN classificationLebanonLibyaLithuaniaLow & middle incomeLow incomeLower middle incomeLuxembourgMacedonia, FYRMalaysiaMaltaMauritiusMexicoMiddle East & North AfricaMiddle East & North Africa (excluding high income)Middle East & North Africa (IDA & IBRD countries)Middle incomeMoldovaMongoliaMontenegroMoroccoMozambiqueMyanmarNamibiaNepalNetherlandsNew ZealandNicaraguaNigerNigeriaNorth AmericaNorwayOECD membersOmanOther small statesPakistanPanamaParaguayPeruPhilippinesPolandPortugalPost-demographic dividendPre-demographic dividendQatarRomaniaRussian FederationSaudi ArabiaSenegalSerbiaSingaporeSlovak RepublicSloveniaSmall statesSouth AfricaSouth AsiaSouth Asia (IDA & IBRD)South SudanSpainSri LankaSub-Saharan Africa Sub-Saharan Africa (excluding high income)Sub-Saharan Africa (IDA & IBRD countries)SudanSwedenSwitzerlandSyrian Arab RepublicTajikistanTanzaniaThailandTogoTrinidad and TobagoTunisiaTurkeyTurkmenistanUkraineUnited Arab EmiratesUnited KingdomUnited StatesUpper middle incomeUruguayUzbekistanVenezuela, RBVietnamWorldYemen, Rep.ZambiaZimbabwe Timeline:
This timeline shows a graph from 1972 to 2014 of Nicaragua. No data until 1971. Number of actual observations by date: 43.
Source name:
World Development Indicators
Source organization:
IEA Statistics © OECD/IEA 2014 (http://www.iea.org/stats/index.asp), subject to https://www.iea.org/t&c/termsandconditions/
Categories, topics:
Environment
Last updated:
apr 23, 2017
Indicators value changes by year
Minimum:
35.142
jan 1, 2007
Maximum:
49.102
jan 1, 1974
At the date of observation
Value
Absolute change
Change from previous value
jan 1, 1972
46.309
+46.309
0.0%
jan 1, 1973
47.059
+0.75
1.62%
jan 1, 1974
49.102
+2.043
4.34%
jan 1, 1975
47.826
-1.276
-2.6%
jan 1, 1976
48.649
+0.823
1.72%
jan 1, 1977
47.17
-1.479
-3.04%
jan 1, 1978
42.529
-4.641
-9.84%
jan 1, 1979
43.404
+0.876
2.06%
jan 1, 1980
48.052
+4.648
10.71%
jan 1, 1981
48.619
+0.567
1.18%
jan 1, 1982
47.09
-1.529
-3.14%
jan 1, 1983
45.455
-1.635
-3.47%
jan 1, 1984
44.388
-1.067
-2.35%
jan 1, 1985
46.927
+2.54
5.72%
jan 1, 1986
45.304
-1.624
-3.46%
jan 1, 1987
42.723
-2.581
-5.7%
jan 1, 1988
43.519
+0.796
1.86%
jan 1, 1989
42.708
-0.81
-1.86%
jan 1, 1990
42.105
-0.603
-1.41%
jan 1, 1991
40.217
-1.888
-4.48%
jan 1, 1992
44.505
+4.288
10.66%
jan 1, 1993
43.396
-1.109
-2.49%
jan 1, 1994
45.455
+2.058
4.74%
jan 1, 1995
42.259
-3.195
-7.03%
jan 1, 1996
44.223
+1.964
4.65%
jan 1, 1997
43.985
-0.238
-0.54%
jan 1, 1998
43.007
-0.978
-2.22%
jan 1, 1999
39.881
-3.126
-7.27%
jan 1, 2000
41.593
+1.712
4.29%
jan 1, 2001
40.96
-0.632
-1.52%
jan 1, 2002
39.623
-1.338
-3.27%
jan 1, 2003
39.948
+0.325
0.82%
jan 1, 2004
38.481
-1.467
-3.67%
jan 1, 2005
35.61
-2.871
-7.46%
jan 1, 2006
35.98
+0.37
1.04%
jan 1, 2007
35.142
-0.839
-2.33%
jan 1, 2008
35.55
+0.409
1.16%
jan 1, 2009
36.038
+0.488
1.37%
jan 1, 2010
36.93
+0.892
2.48%
jan 1, 2011
38.621
+1.69
4.58%
jan 1, 2012
37.36
-1.261
-3.26%
jan 1, 2013
40.181
+2.82
7.55%
jan 1, 2014
39.905
-0.276
-0.69%
Ranking of countries by current statistics by years


Comments: