29
/
en
AIzaSyAYiBZKx7MnpbEhh9jyipgxe19OcubqV5w
April 1, 2024
164597
Jordan
JOR
true
2
1
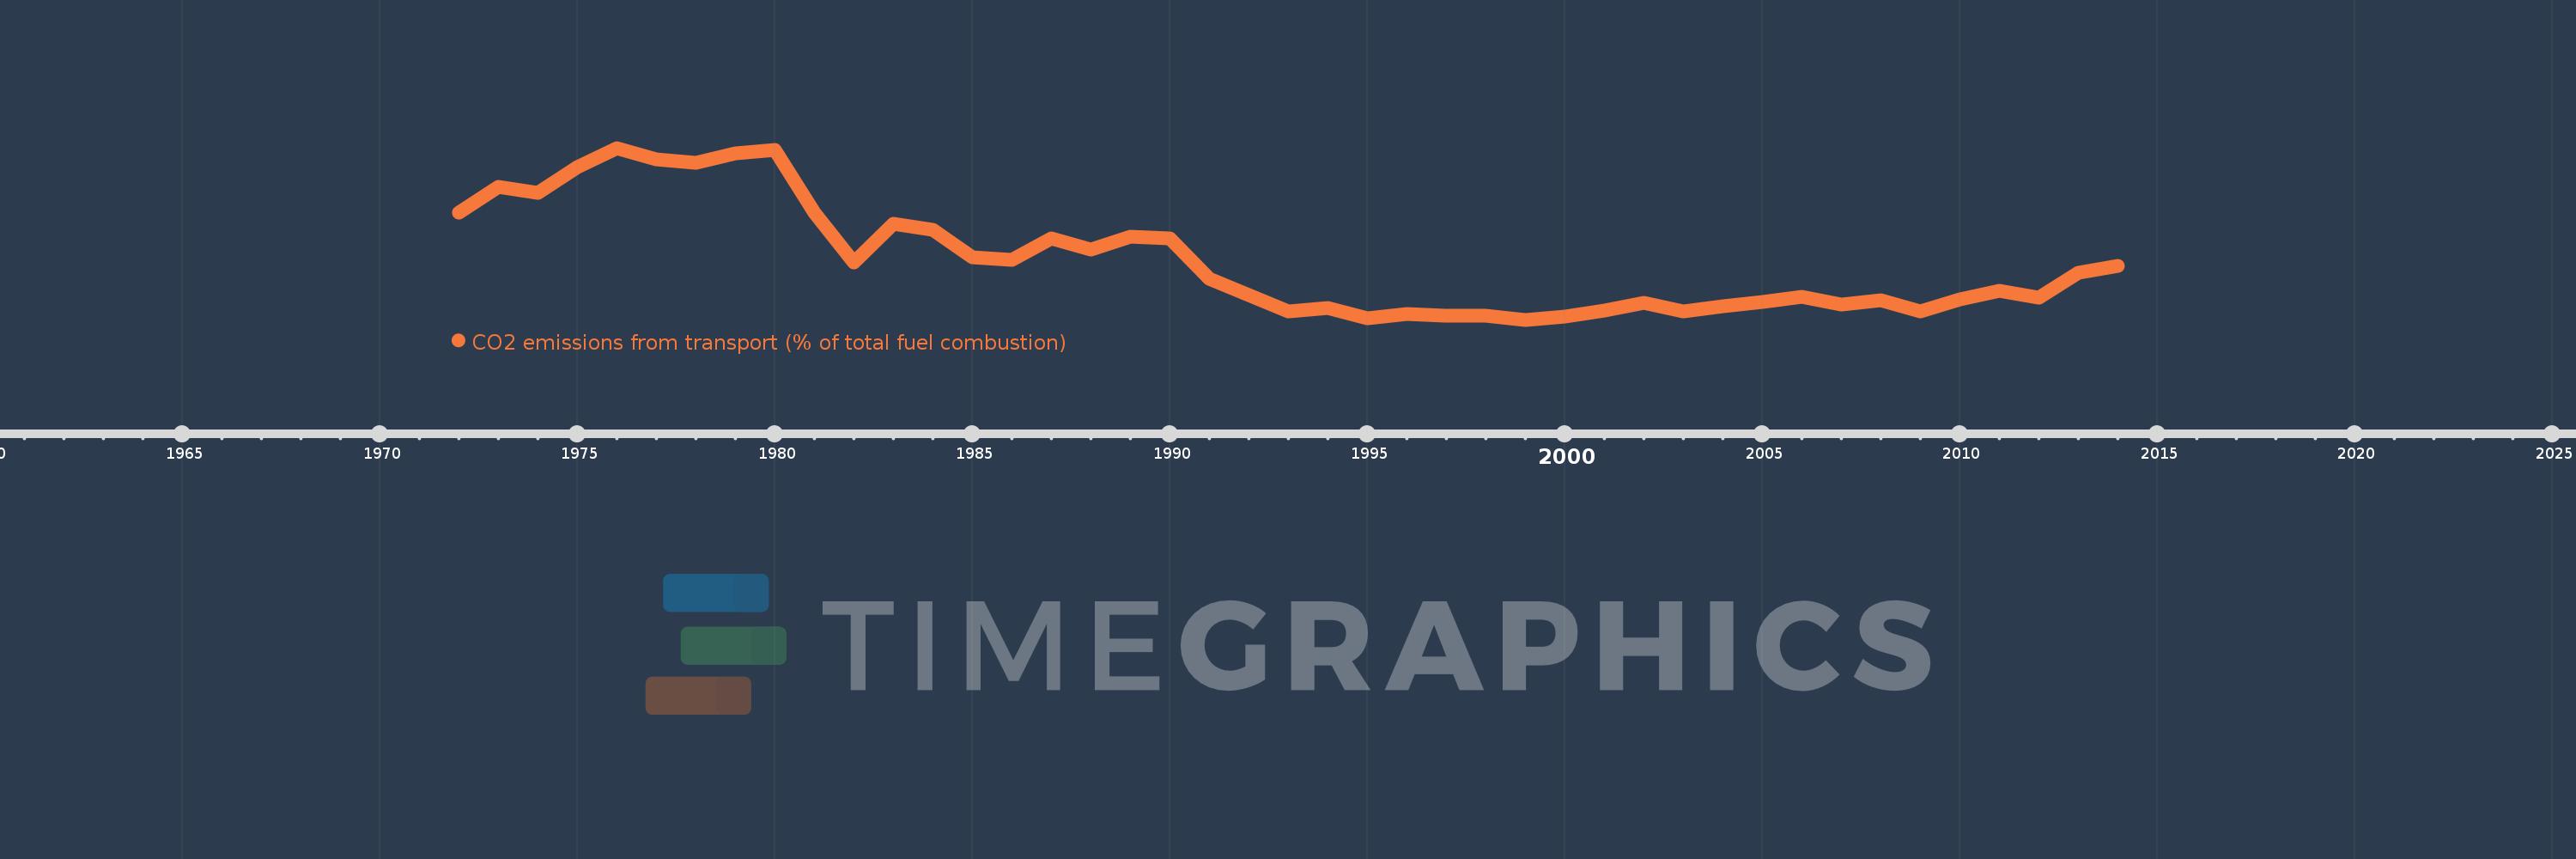
CO2 emissions from transport (% of total fuel combustion)
2014,2013,2012,2011,2010,2009,2008,2007,2006,2005,2004,2003,2002,2001,2000,1999,1998,1997,1996,1995,1994,1993,1992,1991,1990,1989,1988,1987,1986,1985,1984,1983,1982,1981,1980,1979,1978,1977,1976,1975,1974,1973,1972
This statistics in other country:
AlbaniaAlgeriaAngolaArab WorldArgentinaArmeniaAustraliaAustriaAzerbaijanBahrainBangladeshBelarusBelgiumBeninBoliviaBosnia and HerzegovinaBotswanaBrazilBrunei DarussalamBulgariaCambodiaCameroonCanadaCaribbean small statesCentral Europe and the BalticsChileChinaColombiaCongo, Dem. Rep.Congo, Rep.Costa RicaCote d'IvoireCroatiaCubaCuracaoCyprusCzech RepublicDenmarkDominican RepublicEarly-demographic dividendEast Asia & PacificEast Asia & Pacific (excluding high income)East Asia & Pacific (IDA & IBRD countries)EcuadorEgypt, Arab Rep.El SalvadorEritreaEstoniaEthiopiaEuro areaEurope & Central AsiaEurope & Central Asia (excluding high income)Europe & Central Asia (IDA & IBRD countries)European UnionFinlandFragile and conflict affected situationsFranceGabonGeorgiaGermanyGhanaGibraltarGreeceGuatemalaHaitiHeavily indebted poor countries (HIPC)High incomeHondurasHong Kong SAR, ChinaHungaryIBRD onlyIcelandIDA & IBRD totalIDA blendIDA onlyIDA totalIndiaIndonesiaIran, Islamic Rep.IraqIrelandIsraelItalyJamaicaJapanJordanKazakhstanKenyaKorea, Dem. People’s Rep.Korea, Rep.KosovoKuwaitKyrgyz RepublicLate-demographic dividendLatin America & Caribbean Latin America & Caribbean (excluding high income)Latin America & the Caribbean (IDA & IBRD countries)LatviaLeast developed countries: UN classificationLebanonLibyaLithuaniaLow & middle incomeLow incomeLower middle incomeLuxembourgMacedonia, FYRMalaysiaMaltaMauritiusMexicoMiddle East & North AfricaMiddle East & North Africa (excluding high income)Middle East & North Africa (IDA & IBRD countries)Middle incomeMoldovaMongoliaMontenegroMoroccoMozambiqueMyanmarNamibiaNepalNetherlandsNew ZealandNicaraguaNigerNigeriaNorth AmericaNorwayOECD membersOmanOther small statesPakistanPanamaParaguayPeruPhilippinesPolandPortugalPost-demographic dividendPre-demographic dividendQatarRomaniaRussian FederationSaudi ArabiaSenegalSerbiaSingaporeSlovak RepublicSloveniaSmall statesSouth AfricaSouth AsiaSouth Asia (IDA & IBRD)South SudanSpainSri LankaSub-Saharan Africa Sub-Saharan Africa (excluding high income)Sub-Saharan Africa (IDA & IBRD countries)SudanSwedenSwitzerlandSyrian Arab RepublicTajikistanTanzaniaThailandTogoTrinidad and TobagoTunisiaTurkeyTurkmenistanUkraineUnited Arab EmiratesUnited KingdomUnited StatesUpper middle incomeUruguayUzbekistanVenezuela, RBVietnamWorldYemen, Rep.ZambiaZimbabwe Timeline:
This timeline shows a graph from 1972 to 2014 of Jordan. No data until 1971. Number of actual observations by date: 43.
Source name:
World Development Indicators
Source organization:
IEA Statistics © OECD/IEA 2014 (http://www.iea.org/stats/index.asp), subject to https://www.iea.org/t&c/termsandconditions/
Categories, topics:
Environment
Last updated:
apr 23, 2017
Indicators value changes by year
Minimum:
23.654
jan 1, 1999
Maximum:
47.442
jan 1, 1976
At the date of observation
Value
Absolute change
Change from previous value
jan 1, 1972
38.519
+38.519
0.0%
jan 1, 1973
42.0
+3.481
9.04%
jan 1, 1974
41.279
-0.721
-1.72%
jan 1, 1975
44.809
+3.53
8.55%
jan 1, 1976
47.442
+2.633
5.88%
jan 1, 1977
45.833
-1.609
-3.39%
jan 1, 1978
45.357
-0.476
-1.04%
jan 1, 1979
46.726
+1.369
3.02%
jan 1, 1980
47.11
+0.384
0.82%
jan 1, 1981
38.515
-8.595
-18.24%
jan 1, 1982
31.559
-6.956
-18.06%
jan 1, 1983
36.895
+5.336
16.91%
jan 1, 1984
36.141
-0.754
-2.04%
jan 1, 1985
32.345
-3.796
-10.5%
jan 1, 1986
31.995
-0.35
-1.08%
jan 1, 1987
34.951
+2.957
9.24%
jan 1, 1988
33.41
-1.541
-4.41%
jan 1, 1989
35.196
+1.786
5.35%
jan 1, 1990
34.9
-0.296
-0.84%
jan 1, 1991
29.355
-5.545
-15.89%
jan 1, 1992
27.117
-2.238
-7.62%
jan 1, 1993
24.791
-2.326
-8.58%
jan 1, 1994
25.229
+0.438
1.77%
jan 1, 1995
23.83
-1.399
-5.55%
jan 1, 1996
24.47
+0.64
2.68%
jan 1, 1997
24.19
-0.28
-1.14%
jan 1, 1998
24.245
+0.055
0.23%
jan 1, 1999
23.654
-0.591
-2.44%
jan 1, 2000
24.128
+0.474
2.01%
jan 1, 2001
24.879
+0.751
3.11%
jan 1, 2002
25.944
+1.065
4.28%
jan 1, 2003
24.835
-1.109
-4.27%
jan 1, 2004
25.55
+0.715
2.88%
jan 1, 2005
26.128
+0.578
2.26%
jan 1, 2006
26.781
+0.653
2.5%
jan 1, 2007
25.784
-0.997
-3.72%
jan 1, 2008
26.332
+0.548
2.13%
jan 1, 2009
24.826
-1.506
-5.72%
jan 1, 2010
26.519
+1.693
6.82%
jan 1, 2011
27.648
+1.129
4.26%
jan 1, 2012
26.744
-0.905
-3.27%
jan 1, 2013
30.158
+3.414
12.77%
jan 1, 2014
31.157
+0.999
3.31%
Ranking of countries by current statistics by years


Comments: