29
/
en
AIzaSyAYiBZKx7MnpbEhh9jyipgxe19OcubqV5w
April 1, 2024
125927
El Salvador
SLV
true
2
1
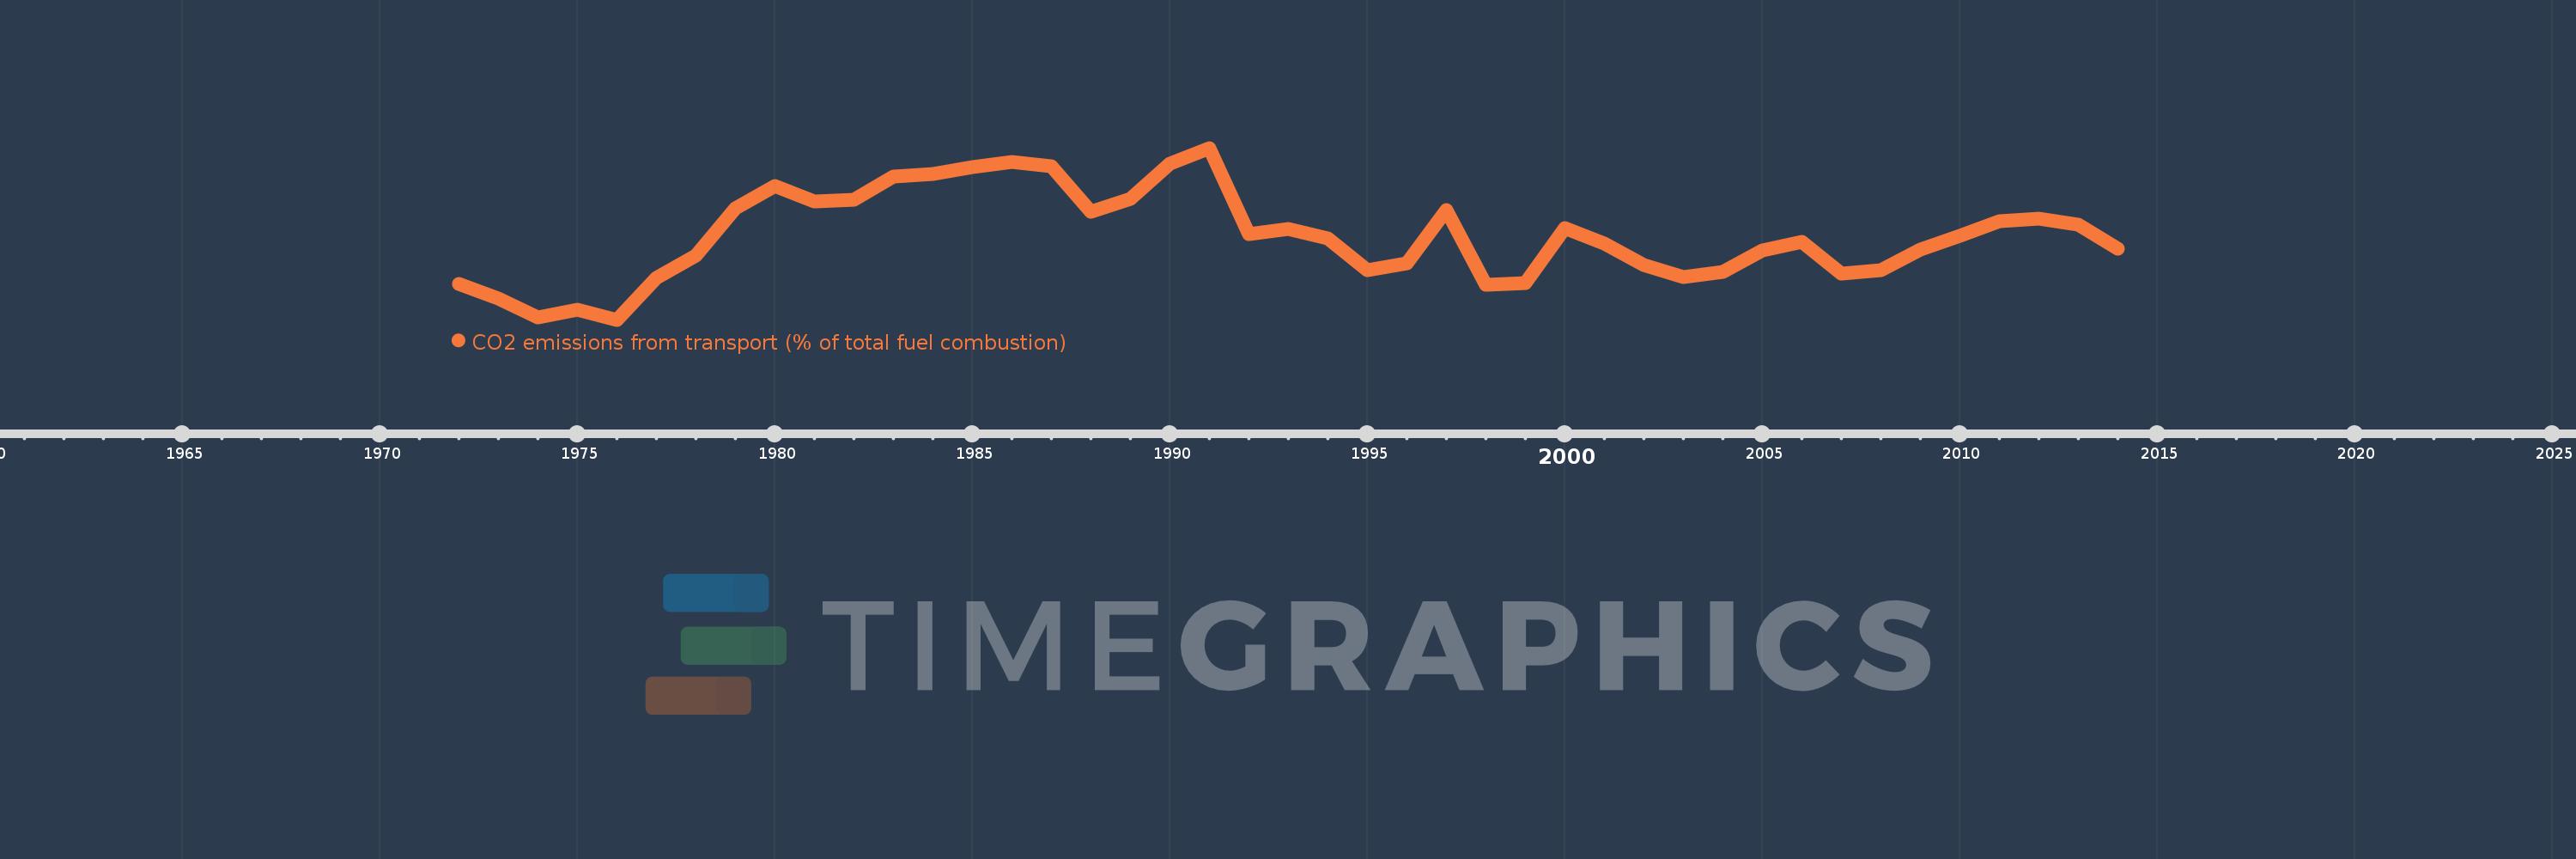
CO2 emissions from transport (% of total fuel combustion)
2014,2013,2012,2011,2010,2009,2008,2007,2006,2005,2004,2003,2002,2001,2000,1999,1998,1997,1996,1995,1994,1993,1992,1991,1990,1989,1988,1987,1986,1985,1984,1983,1982,1981,1980,1979,1978,1977,1976,1975,1974,1973,1972
This statistics in other country:
AlbaniaAlgeriaAngolaArab WorldArgentinaArmeniaAustraliaAustriaAzerbaijanBahrainBangladeshBelarusBelgiumBeninBoliviaBosnia and HerzegovinaBotswanaBrazilBrunei DarussalamBulgariaCambodiaCameroonCanadaCaribbean small statesCentral Europe and the BalticsChileChinaColombiaCongo, Dem. Rep.Congo, Rep.Costa RicaCote d'IvoireCroatiaCubaCuracaoCyprusCzech RepublicDenmarkDominican RepublicEarly-demographic dividendEast Asia & PacificEast Asia & Pacific (excluding high income)East Asia & Pacific (IDA & IBRD countries)EcuadorEgypt, Arab Rep.El SalvadorEritreaEstoniaEthiopiaEuro areaEurope & Central AsiaEurope & Central Asia (excluding high income)Europe & Central Asia (IDA & IBRD countries)European UnionFinlandFragile and conflict affected situationsFranceGabonGeorgiaGermanyGhanaGibraltarGreeceGuatemalaHaitiHeavily indebted poor countries (HIPC)High incomeHondurasHong Kong SAR, ChinaHungaryIBRD onlyIcelandIDA & IBRD totalIDA blendIDA onlyIDA totalIndiaIndonesiaIran, Islamic Rep.IraqIrelandIsraelItalyJamaicaJapanJordanKazakhstanKenyaKorea, Dem. People’s Rep.Korea, Rep.KosovoKuwaitKyrgyz RepublicLate-demographic dividendLatin America & Caribbean Latin America & Caribbean (excluding high income)Latin America & the Caribbean (IDA & IBRD countries)LatviaLeast developed countries: UN classificationLebanonLibyaLithuaniaLow & middle incomeLow incomeLower middle incomeLuxembourgMacedonia, FYRMalaysiaMaltaMauritiusMexicoMiddle East & North AfricaMiddle East & North Africa (excluding high income)Middle East & North Africa (IDA & IBRD countries)Middle incomeMoldovaMongoliaMontenegroMoroccoMozambiqueMyanmarNamibiaNepalNetherlandsNew ZealandNicaraguaNigerNigeriaNorth AmericaNorwayOECD membersOmanOther small statesPakistanPanamaParaguayPeruPhilippinesPolandPortugalPost-demographic dividendPre-demographic dividendQatarRomaniaRussian FederationSaudi ArabiaSenegalSerbiaSingaporeSlovak RepublicSloveniaSmall statesSouth AfricaSouth AsiaSouth Asia (IDA & IBRD)South SudanSpainSri LankaSub-Saharan Africa Sub-Saharan Africa (excluding high income)Sub-Saharan Africa (IDA & IBRD countries)SudanSwedenSwitzerlandSyrian Arab RepublicTajikistanTanzaniaThailandTogoTrinidad and TobagoTunisiaTurkeyTurkmenistanUkraineUnited Arab EmiratesUnited KingdomUnited StatesUpper middle incomeUruguayUzbekistanVenezuela, RBVietnamWorldYemen, Rep.ZambiaZimbabwe Timeline:
This timeline shows a graph from 1972 to 2014 of El Salvador. No data until 1971. Number of actual observations by date: 43.
Source name:
World Development Indicators
Source organization:
IEA Statistics © OECD/IEA 2014 (http://www.iea.org/stats/index.asp), subject to https://www.iea.org/t&c/termsandconditions/
Categories, topics:
Environment
Last updated:
apr 23, 2017
Indicators value changes by year
Minimum:
39.583
jan 1, 1976
At the date of observation
Value
Absolute change
Change from previous value
jan 1, 1972
43.846
+43.846
0.0%
jan 1, 1973
42.105
-1.741
-3.97%
jan 1, 1974
39.881
-2.224
-5.28%
jan 1, 1975
40.828
+0.947
2.38%
jan 1, 1976
39.583
-1.245
-3.05%
jan 1, 1977
44.615
+5.032
12.71%
jan 1, 1978
47.264
+2.648
5.94%
jan 1, 1979
52.97
+5.707
12.07%
jan 1, 1980
55.67
+2.7
5.1%
jan 1, 1981
53.75
-1.92
-3.45%
jan 1, 1982
54.0
+0.25
0.47%
jan 1, 1983
56.757
+2.757
5.11%
jan 1, 1984
57.047
+0.29
0.51%
jan 1, 1985
57.895
+0.848
1.49%
jan 1, 1986
58.537
+0.642
1.11%
jan 1, 1987
58.025
-0.512
-0.87%
jan 1, 1988
52.5
-5.525
-9.52%
jan 1, 1989
54.067
+1.567
2.98%
jan 1, 1990
58.333
+4.266
7.89%
jan 1, 1991
60.19
+1.856
3.18%
jan 1, 1992
49.819
-10.37
-17.23%
jan 1, 1993
50.473
+0.654
1.31%
jan 1, 1994
49.296
-1.177
-2.33%
jan 1, 1995
45.477
-3.819
-7.75%
jan 1, 1996
46.389
+0.913
2.01%
jan 1, 1997
52.764
+6.374
13.74%
jan 1, 1998
43.737
-9.027
-17.11%
jan 1, 1999
43.954
+0.217
0.5%
jan 1, 2000
50.581
+6.627
15.08%
jan 1, 2001
48.743
-1.839
-3.64%
jan 1, 2002
46.098
-2.645
-5.43%
jan 1, 2003
44.665
-1.433
-3.11%
jan 1, 2004
45.347
+0.681
1.53%
jan 1, 2005
47.892
+2.545
5.61%
jan 1, 2006
48.96
+1.068
2.23%
jan 1, 2007
45.092
-3.868
-7.9%
jan 1, 2008
45.52
+0.428
0.95%
jan 1, 2009
48.046
+2.525
5.55%
jan 1, 2010
49.675
+1.63
3.39%
jan 1, 2011
51.365
+1.69
3.4%
jan 1, 2012
51.747
+0.382
0.74%
jan 1, 2013
50.977
-0.77
-1.49%
jan 1, 2014
48.097
-2.88
-5.65%
Ranking of countries by current statistics by years


Comments: