29
/
en
AIzaSyAYiBZKx7MnpbEhh9jyipgxe19OcubqV5w
April 1, 2024
257121
Switzerland
CHE
true
2
1
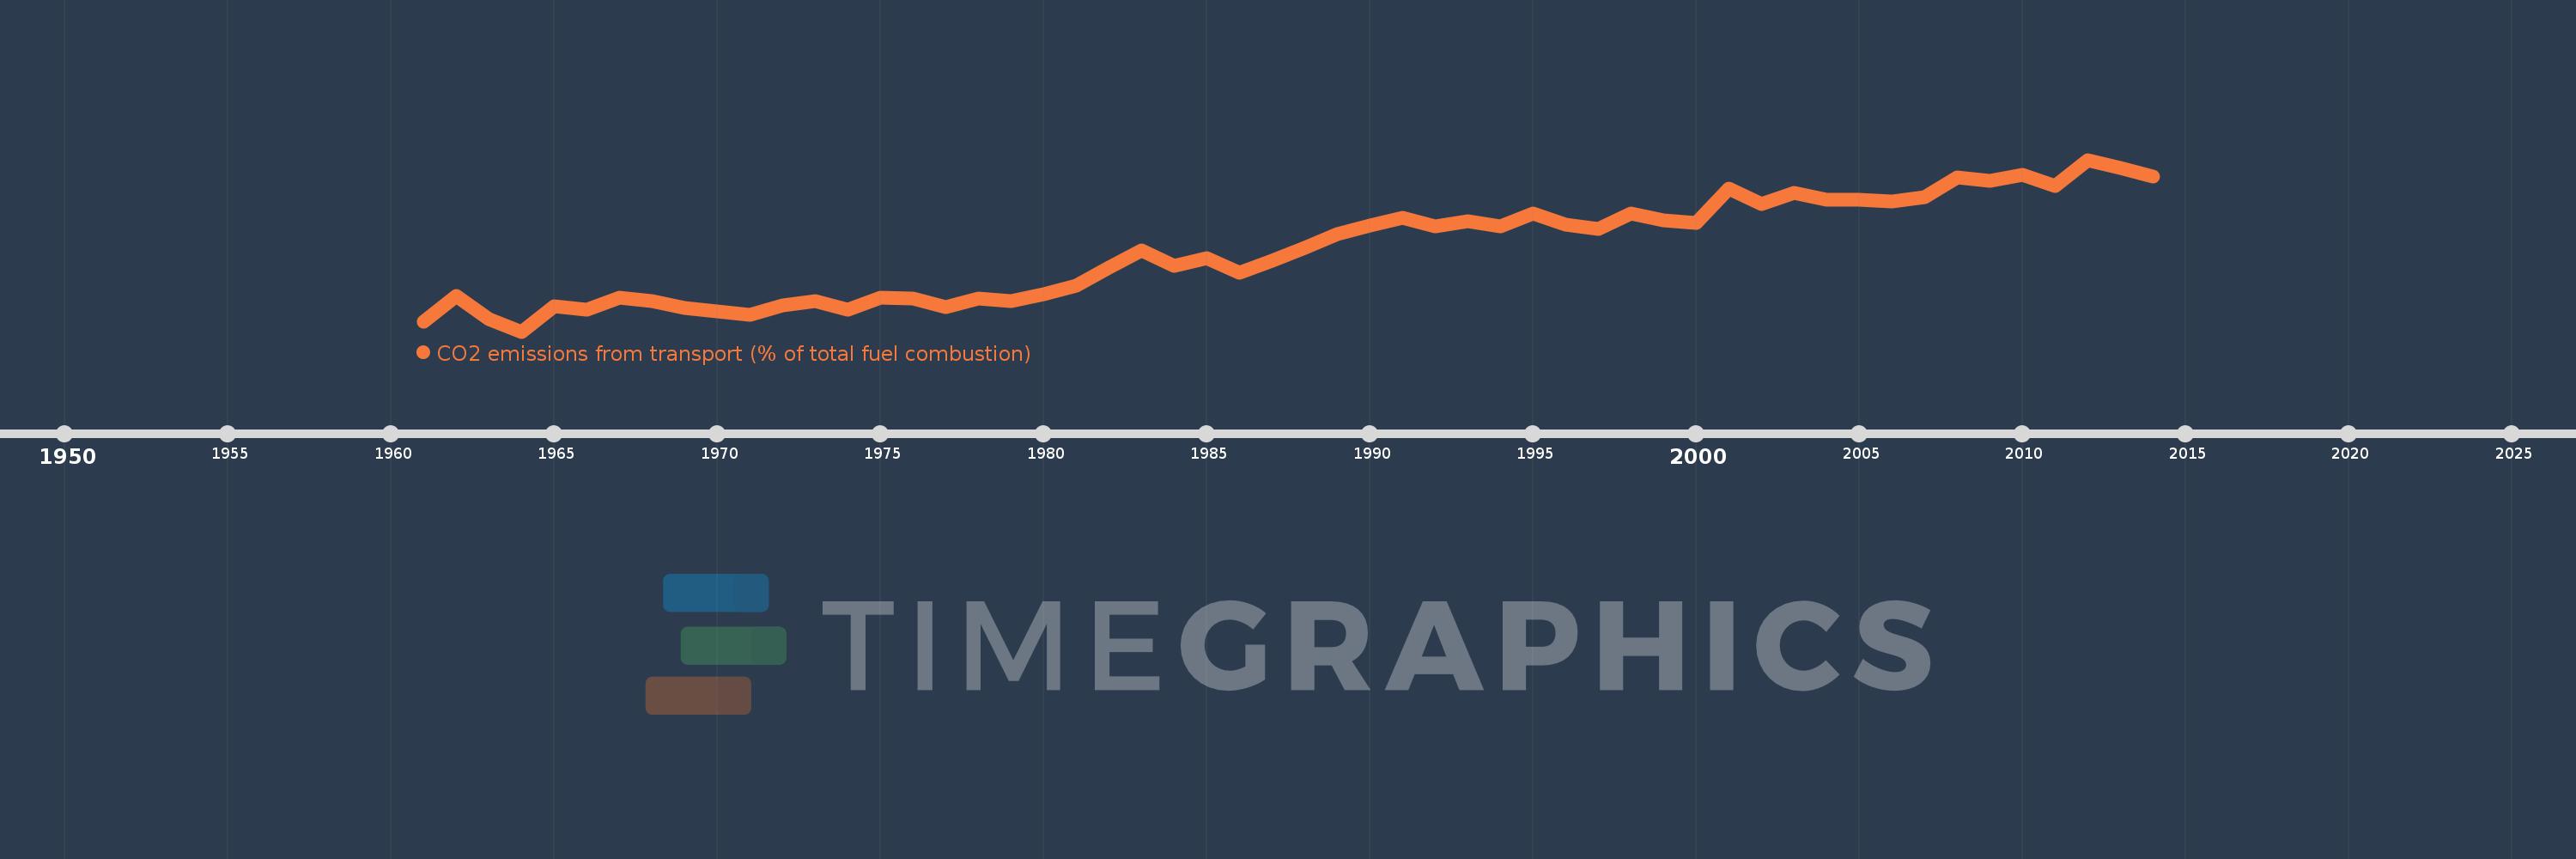
CO2 emissions from transport (% of total fuel combustion)
2014,2013,2012,2011,2010,2009,2008,2007,2006,2005,2004,2003,2002,2001,2000,1999,1998,1997,1996,1995,1994,1993,1992,1991,1990,1989,1988,1987,1986,1985,1984,1983,1982,1981,1980,1979,1978,1977,1976,1975,1974,1973,1972,1971,1970,1969,1968,1967,1966,1965,1964,1963,1962,1961
This statistics in other country:
AlbaniaAlgeriaAngolaArab WorldArgentinaArmeniaAustraliaAustriaAzerbaijanBahrainBangladeshBelarusBelgiumBeninBoliviaBosnia and HerzegovinaBotswanaBrazilBrunei DarussalamBulgariaCambodiaCameroonCanadaCaribbean small statesCentral Europe and the BalticsChileChinaColombiaCongo, Dem. Rep.Congo, Rep.Costa RicaCote d'IvoireCroatiaCubaCuracaoCyprusCzech RepublicDenmarkDominican RepublicEarly-demographic dividendEast Asia & PacificEast Asia & Pacific (excluding high income)East Asia & Pacific (IDA & IBRD countries)EcuadorEgypt, Arab Rep.El SalvadorEritreaEstoniaEthiopiaEuro areaEurope & Central AsiaEurope & Central Asia (excluding high income)Europe & Central Asia (IDA & IBRD countries)European UnionFinlandFragile and conflict affected situationsFranceGabonGeorgiaGermanyGhanaGibraltarGreeceGuatemalaHaitiHeavily indebted poor countries (HIPC)High incomeHondurasHong Kong SAR, ChinaHungaryIBRD onlyIcelandIDA & IBRD totalIDA blendIDA onlyIDA totalIndiaIndonesiaIran, Islamic Rep.IraqIrelandIsraelItalyJamaicaJapanJordanKazakhstanKenyaKorea, Dem. People’s Rep.Korea, Rep.KosovoKuwaitKyrgyz RepublicLate-demographic dividendLatin America & Caribbean Latin America & Caribbean (excluding high income)Latin America & the Caribbean (IDA & IBRD countries)LatviaLeast developed countries: UN classificationLebanonLibyaLithuaniaLow & middle incomeLow incomeLower middle incomeLuxembourgMacedonia, FYRMalaysiaMaltaMauritiusMexicoMiddle East & North AfricaMiddle East & North Africa (excluding high income)Middle East & North Africa (IDA & IBRD countries)Middle incomeMoldovaMongoliaMontenegroMoroccoMozambiqueMyanmarNamibiaNepalNetherlandsNew ZealandNicaraguaNigerNigeriaNorth AmericaNorwayOECD membersOmanOther small statesPakistanPanamaParaguayPeruPhilippinesPolandPortugalPost-demographic dividendPre-demographic dividendQatarRomaniaRussian FederationSaudi ArabiaSenegalSerbiaSingaporeSlovak RepublicSloveniaSmall statesSouth AfricaSouth AsiaSouth Asia (IDA & IBRD)South SudanSpainSri LankaSub-Saharan Africa Sub-Saharan Africa (excluding high income)Sub-Saharan Africa (IDA & IBRD countries)SudanSwedenSwitzerlandSyrian Arab RepublicTajikistanTanzaniaThailandTogoTrinidad and TobagoTunisiaTurkeyTurkmenistanUkraineUnited Arab EmiratesUnited KingdomUnited StatesUpper middle incomeUruguayUzbekistanVenezuela, RBVietnamWorldYemen, Rep.ZambiaZimbabwe Timeline:
This timeline shows a graph from 1961 to 2014 of Switzerland. No data until 1960. Number of actual observations by date: 54.
Source name:
World Development Indicators
Source organization:
IEA Statistics © OECD/IEA 2014 (http://www.iea.org/stats/index.asp), subject to https://www.iea.org/t&c/termsandconditions/
Categories, topics:
Environment
Last updated:
apr 23, 2017
Indicators value changes by year
Minimum:
20.023
jan 1, 1964
Maximum:
43.483
jan 1, 2012
At the date of observation
Value
Absolute change
Change from previous value
jan 1, 1961
21.429
+21.429
0.0%
jan 1, 1962
24.878
+3.449
16.1%
jan 1, 1963
21.772
-3.106
-12.48%
jan 1, 1964
20.023
-1.75
-8.04%
jan 1, 1965
23.467
+3.444
17.2%
jan 1, 1966
22.961
-0.506
-2.15%
jan 1, 1967
24.605
+1.644
7.16%
jan 1, 1968
24.206
-0.399
-1.62%
jan 1, 1969
23.243
-0.963
-3.98%
jan 1, 1970
22.81
-0.433
-1.86%
jan 1, 1971
22.363
-0.447
-1.96%
jan 1, 1972
23.619
+1.256
5.61%
jan 1, 1973
24.206
+0.588
2.49%
jan 1, 1974
23.063
-1.144
-4.72%
jan 1, 1975
24.656
+1.593
6.91%
jan 1, 1976
24.524
-0.132
-0.54%
jan 1, 1977
23.334
-1.189
-4.85%
jan 1, 1978
24.525
+1.191
5.1%
jan 1, 1979
24.214
-0.311
-1.27%
jan 1, 1980
25.155
+0.941
3.89%
jan 1, 1981
26.318
+1.163
4.62%
jan 1, 1982
28.765
+2.446
9.3%
jan 1, 1983
31.119
+2.354
8.19%
jan 1, 1984
29.032
-2.087
-6.71%
jan 1, 1985
30.099
+1.066
3.67%
jan 1, 1986
28.041
-2.057
-6.84%
jan 1, 1987
29.669
+1.628
5.8%
jan 1, 1988
31.492
+1.823
6.15%
jan 1, 1989
33.367
+1.875
5.95%
jan 1, 1990
34.516
+1.149
3.44%
jan 1, 1991
35.6
+1.084
3.14%
jan 1, 1992
34.431
-1.169
-3.28%
jan 1, 1993
35.077
+0.646
1.88%
jan 1, 1994
34.352
-0.724
-2.07%
jan 1, 1995
36.117
+1.764
5.14%
jan 1, 1996
34.677
-1.44
-3.99%
jan 1, 1997
34.076
-0.601
-1.73%
jan 1, 1998
36.114
+2.038
5.98%
jan 1, 1999
35.18
-0.934
-2.59%
jan 1, 2000
34.903
-0.276
-0.79%
jan 1, 2001
39.499
+4.596
13.17%
jan 1, 2002
37.48
-2.019
-5.11%
jan 1, 2003
38.933
+1.453
3.88%
jan 1, 2004
37.993
-0.94
-2.41%
jan 1, 2005
37.978
-0.015
-0.04%
jan 1, 2006
37.779
-0.199
-0.52%
jan 1, 2007
38.439
+0.659
1.74%
jan 1, 2008
41.056
+2.617
6.81%
jan 1, 2009
40.629
-0.427
-1.04%
jan 1, 2010
41.417
+0.788
1.94%
jan 1, 2011
39.907
-1.509
-3.64%
jan 1, 2012
43.483
+3.576
8.96%
jan 1, 2013
42.352
-1.13
-2.6%
jan 1, 2014
41.141
-1.211
-2.86%
Ranking of countries by current statistics by years


Comments: