29
/
en
AIzaSyAYiBZKx7MnpbEhh9jyipgxe19OcubqV5w
April 1, 2024
176170
Lebanon
LBN
true
2
1
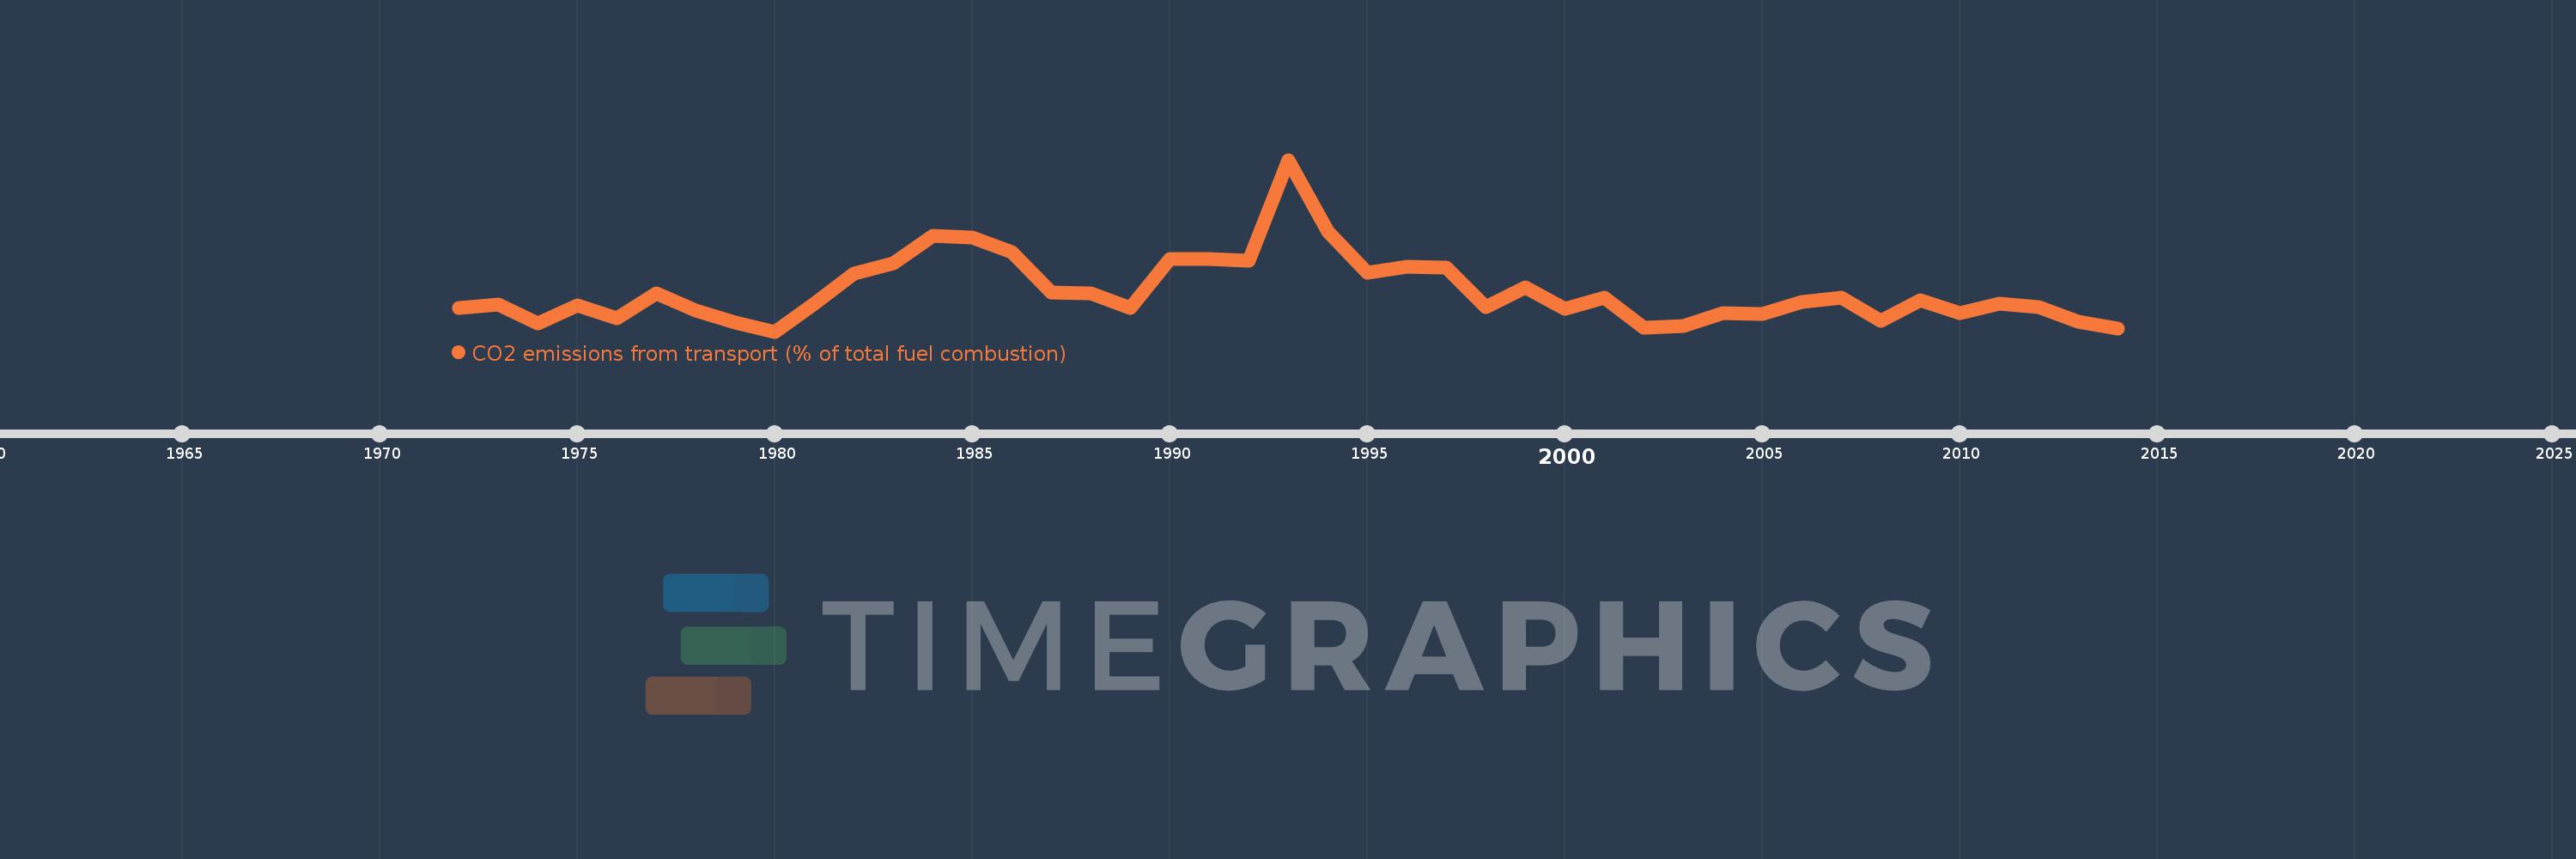
CO2 emissions from transport (% of total fuel combustion)
2014,2013,2012,2011,2010,2009,2008,2007,2006,2005,2004,2003,2002,2001,2000,1999,1998,1997,1996,1995,1994,1993,1992,1991,1990,1989,1988,1987,1986,1985,1984,1983,1982,1981,1980,1979,1978,1977,1976,1975,1974,1973,1972
This statistics in other country:
AlbaniaAlgeriaAngolaArab WorldArgentinaArmeniaAustraliaAustriaAzerbaijanBahrainBangladeshBelarusBelgiumBeninBoliviaBosnia and HerzegovinaBotswanaBrazilBrunei DarussalamBulgariaCambodiaCameroonCanadaCaribbean small statesCentral Europe and the BalticsChileChinaColombiaCongo, Dem. Rep.Congo, Rep.Costa RicaCote d'IvoireCroatiaCubaCuracaoCyprusCzech RepublicDenmarkDominican RepublicEarly-demographic dividendEast Asia & PacificEast Asia & Pacific (excluding high income)East Asia & Pacific (IDA & IBRD countries)EcuadorEgypt, Arab Rep.El SalvadorEritreaEstoniaEthiopiaEuro areaEurope & Central AsiaEurope & Central Asia (excluding high income)Europe & Central Asia (IDA & IBRD countries)European UnionFinlandFragile and conflict affected situationsFranceGabonGeorgiaGermanyGhanaGibraltarGreeceGuatemalaHaitiHeavily indebted poor countries (HIPC)High incomeHondurasHong Kong SAR, ChinaHungaryIBRD onlyIcelandIDA & IBRD totalIDA blendIDA onlyIDA totalIndiaIndonesiaIran, Islamic Rep.IraqIrelandIsraelItalyJamaicaJapanJordanKazakhstanKenyaKorea, Dem. People’s Rep.Korea, Rep.KosovoKuwaitKyrgyz RepublicLate-demographic dividendLatin America & Caribbean Latin America & Caribbean (excluding high income)Latin America & the Caribbean (IDA & IBRD countries)LatviaLeast developed countries: UN classificationLebanonLibyaLithuaniaLow & middle incomeLow incomeLower middle incomeLuxembourgMacedonia, FYRMalaysiaMaltaMauritiusMexicoMiddle East & North AfricaMiddle East & North Africa (excluding high income)Middle East & North Africa (IDA & IBRD countries)Middle incomeMoldovaMongoliaMontenegroMoroccoMozambiqueMyanmarNamibiaNepalNetherlandsNew ZealandNicaraguaNigerNigeriaNorth AmericaNorwayOECD membersOmanOther small statesPakistanPanamaParaguayPeruPhilippinesPolandPortugalPost-demographic dividendPre-demographic dividendQatarRomaniaRussian FederationSaudi ArabiaSenegalSerbiaSingaporeSlovak RepublicSloveniaSmall statesSouth AfricaSouth AsiaSouth Asia (IDA & IBRD)South SudanSpainSri LankaSub-Saharan Africa Sub-Saharan Africa (excluding high income)Sub-Saharan Africa (IDA & IBRD countries)SudanSwedenSwitzerlandSyrian Arab RepublicTajikistanTanzaniaThailandTogoTrinidad and TobagoTunisiaTurkeyTurkmenistanUkraineUnited Arab EmiratesUnited KingdomUnited StatesUpper middle incomeUruguayUzbekistanVenezuela, RBVietnamWorldYemen, Rep.ZambiaZimbabwe Timeline:
This timeline shows a graph from 1972 to 2014 of Lebanon. No data until 1971. Number of actual observations by date: 43.
Source name:
World Development Indicators
Source organization:
IEA Statistics © OECD/IEA 2014 (http://www.iea.org/stats/index.asp), subject to https://www.iea.org/t&c/termsandconditions/
Categories, topics:
Environment
Last updated:
apr 23, 2017
Indicators value changes by year
Minimum:
24.127
jan 1, 1980
Maximum:
46.812
jan 1, 1993
At the date of observation
Value
Absolute change
Change from previous value
jan 1, 1972
27.293
+27.293
0.0%
jan 1, 1973
27.711
+0.418
1.53%
jan 1, 1974
25.196
-2.515
-9.08%
jan 1, 1975
27.581
+2.385
9.47%
jan 1, 1976
25.919
-1.661
-6.02%
jan 1, 1977
29.143
+3.223
12.44%
jan 1, 1978
26.898
-2.245
-7.7%
jan 1, 1979
25.345
-1.553
-5.77%
jan 1, 1980
24.127
-1.218
-4.81%
jan 1, 1981
27.82
+3.693
15.3%
jan 1, 1982
31.754
+3.934
14.14%
jan 1, 1983
33.12
+1.366
4.3%
jan 1, 1984
36.802
+3.682
11.12%
jan 1, 1985
36.514
-0.288
-0.78%
jan 1, 1986
34.644
-1.869
-5.12%
jan 1, 1987
29.32
-5.324
-15.37%
jan 1, 1988
29.184
-0.136
-0.46%
jan 1, 1989
27.239
-1.944
-6.66%
jan 1, 1990
33.757
+6.517
23.93%
jan 1, 1991
33.757
0.0
0.0%
jan 1, 1992
33.525
-0.232
-0.69%
jan 1, 1993
46.812
+13.286
39.63%
jan 1, 1994
37.327
-9.485
-20.26%
jan 1, 1995
31.949
-5.377
-14.41%
jan 1, 1996
32.682
+0.732
2.29%
jan 1, 1997
32.532
-0.15
-0.46%
jan 1, 1998
27.38
-5.152
-15.84%
jan 1, 1999
29.993
+2.613
9.54%
jan 1, 2000
27.157
-2.837
-9.46%
jan 1, 2001
28.592
+1.435
5.29%
jan 1, 2002
24.686
-3.905
-13.66%
jan 1, 2003
24.834
+0.148
0.6%
jan 1, 2004
26.578
+1.744
7.02%
jan 1, 2005
26.399
-0.179
-0.67%
jan 1, 2006
28.008
+1.609
6.1%
jan 1, 2007
28.551
+0.542
1.94%
jan 1, 2008
25.562
-2.988
-10.47%
jan 1, 2009
28.218
+2.656
10.39%
jan 1, 2010
26.57
-1.648
-5.84%
jan 1, 2011
27.802
+1.232
4.64%
jan 1, 2012
27.405
-0.397
-1.43%
jan 1, 2013
25.429
-1.977
-7.21%
jan 1, 2014
24.564
-0.865
-3.4%
Ranking of countries by current statistics by years


Comments: